Recently, the IMF Leader - Christine Lagarde - talked about deflation. She announced we must do all we can do prevent deflation from occurring. In Davos, the IMF released their 2014 World Economic Outlook. Look at the trend they predict for commodities.
That report can be found here. IMF WEC Davos
Even presidents don't trust economists. Truman asked for a one armed economist so they could stop referring to 'On the other hand...'
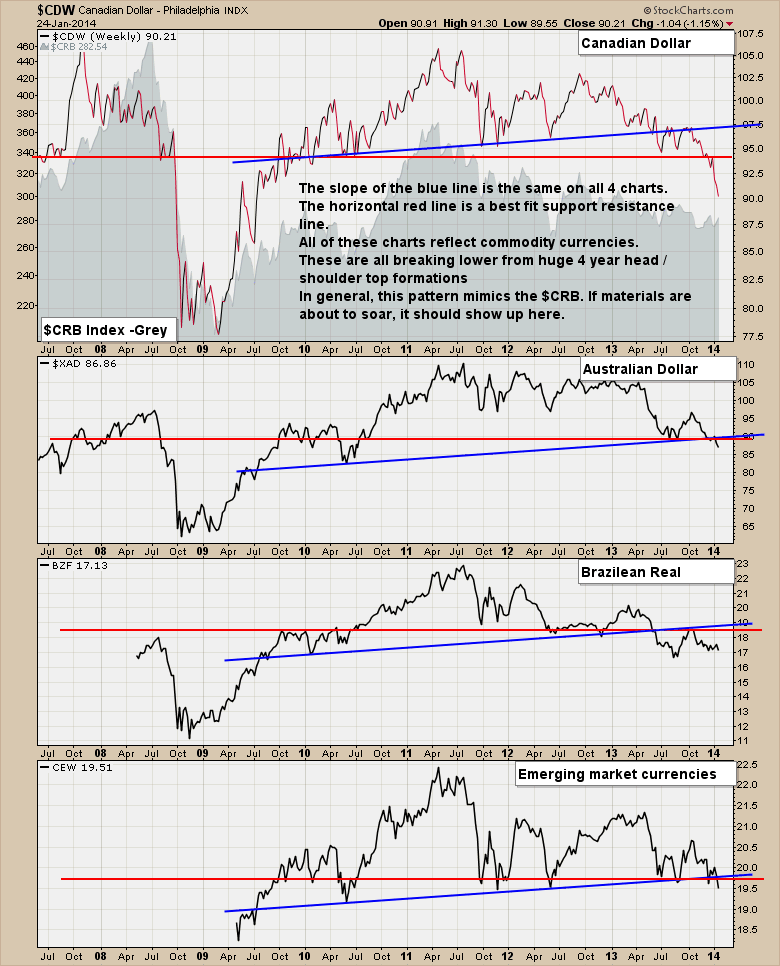
The charts are our best tool to see the current picture in relation to the past. Unfortunately for the commodity countries and currencies, the chart patterns align with the economists views. But how many economists realize the strong negative global alignment of the currencies and the commodities ? More importantly, do they realize the macro charts are all breaking through support together? Look at the chart below with the Canadian Dollar, the Aussie Dollar, the Brazilian Real ETF, the Emerging Market Currencies ETF ,and the grey shaded area is the Commodity Research Bureau Index of 19 commodities.
These are major support levels that are breaking whether you rely on the blue line head/shoulders patterns or just flat horizontal support and resistance lines. Are they permanent? No. But until they get bullish as a group and start reversing these long term scenarios, we have to stay with the trend we are in.
Some of my recent blog postings have been discussing the XMA.TO which tracks materials. This should be the next sector to break out higher as the industrials had a fabulous year last year. One concern is XMA.TO seems to start every January since 2010 with a roar, then roll over and move lower.
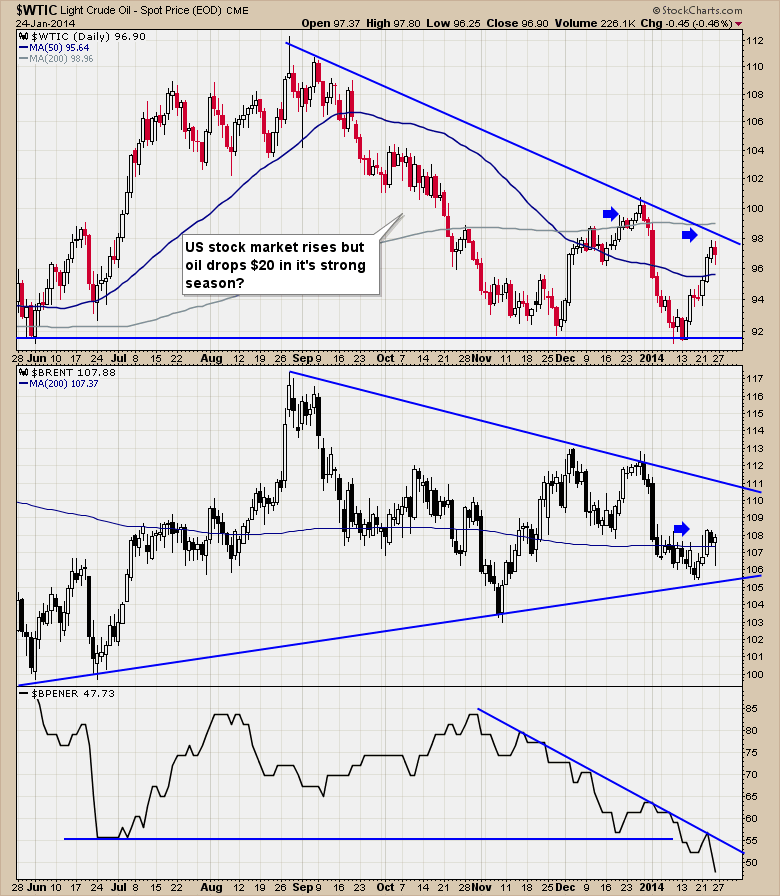
On Friday, the $WTIC crude chart continued to test the 200 DMA from the bottom. The oil energy stocks are leaving the party as shown in the $BPENER chart. The Bullish percent index($BPENER) is in a serious downtrend and has broken to recent lows. The July to April time is usually strong for oil stocks. But something happened this year. While oil was making highs of $112 dollars, the $BPENER rolled over from 84 to 65. This is an important divergence. More importantly right now is the oil test of the flat or down sloping 200 DMA depending on if you are looking at $WTIC or $BRENT. A fail here would be extremely bearish. If $WTIC can't make it above the 200 DMA on a polar vortex, what will it do in warmer spring temperatures?
It could be nothing and everything can reverse higher. The night is darkest just before dawn. However the recent flush down of the Canadian Dollar, the continued downtrend in the Aussie Dollar, the Brazilian Real, and emerging market currencies point to trouble ahead. The breakdown in the energy stocks is a big deal for a Calgarian. The next few weeks will need a sharp eye on oil and how it behaves at the 200 DMA. Should it fail here in concert with $BRENT, I would expect something major is changing in the economy. One other clue might be the 4% plummet in the transports on Friday seeming to confirm the weakness in the Dow Industrials.
Let's not get all bearish. I would just yell from the rooftops to be watching the oil and energy related stocks. The price action over the next few weeks will be very telling. Tests of the 200 DMA from below on both $BRENT and $WTIC will be important clues.
Good Trading,
Greg Schnell, CMT


