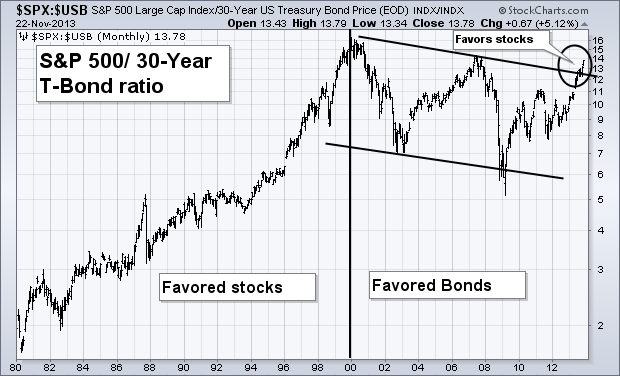
There's a positive side effect to rising bond yields. When bond yields rise, bond prices fall. When bond prices fall, investors start moving money into stocks. That sequence supports the view that higher bond yields are already causing a generational shift in favor of stocks. Chart 1 plots a "ratio" of the S&P 500 divided by the price of the 30-Year T-bond. [A ratio is created by inserting a colon (:) between the two symbols ($SPX:$USB)]. The rising ratio between 1980 and 2000 favored stocks over bonds. The last decade favored bonds over stocks. Until now. The ratio actually bottomed during 2009. To the upper right, however, you can the stock/bond ratio exceeding its upper "channel line" drawn over its 2000/2007 (circle). That suggests that a generational shift is taking place in favor of stocks over bonds. In other words, the "great rotation" out of bonds and into stocks is well underway.
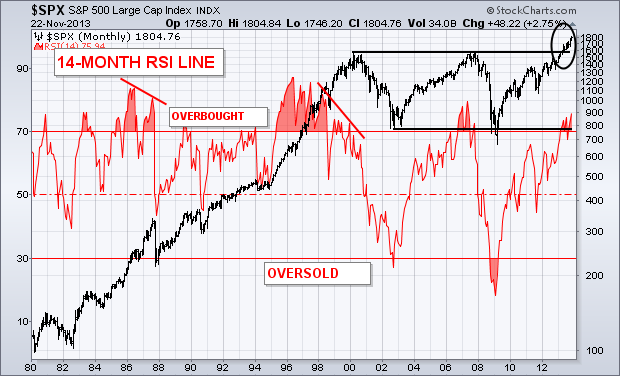
OVERBOUGHT READINGS IN A SECULAR BULL AREN'T AS RELIABLE... Momentum oscillators tell us whether the stock market is overbought or oversold. But they have to be kept in perspective. During a secular bull market (a long term uptrend), the market can stay overbought for long periods of time. Chart 2 applies the 14-month RSI (red) line to the S&P 500 since 1980. The market reached overbought territory several times during the secular bull market between 1982 and 2000 and stayed there for years. The RSI line remained overbought during 1985 and 1986 as the market rose. During 1987, a major "negative divergence" in the RSI line (falling trendline) warned of a dangerous market condition which led to major stock selloff. [A negative divergence is present when the oscillator forms lower peaks while stocks are rising]. The RSI line also stayed overbought between 1995 and 1999 as the market rose. It took another major "negative divergence" during 2000 (falling trendline) to warn of a possible market top. During a secular bear market, which began in 2000, oscillators become more useful. Major oversold conditions in the RSI (below 30) during 2002 and early 2009 suggested major market bottoms. An overbought reading during 2007 led to a major market collapse. The circle to the upper right, however, shows the S&P 500 breaking out of its decade-long trading range which signals the start of a new secular bull market in stocks. In that environment, overbought oscillator readings are less relevant. First of all, the current RSI reading (while overbought) is still well below overbought levels reached during 2007, the late 1990s, and 1987. Secondly, there's no sign of a negative divergence. That doesn't mean that the market is immune from a downside correction (which is more likely during 2014 than this year). It does means, however, that overbought readings are less meaningful in a secular bull market. In a secular bull market (like the one we're currently in), the stock market can get overbought and stay there for a long time.


