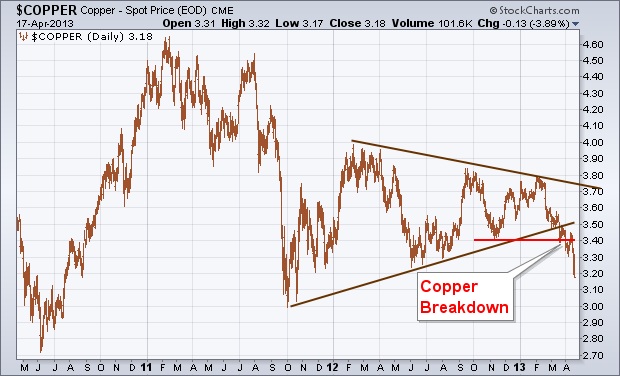
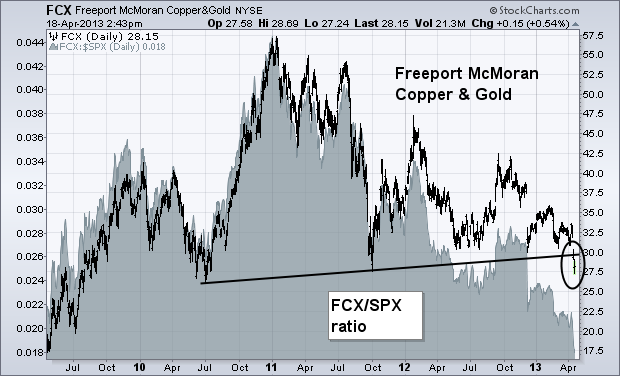
Of all the commodity markets, copper is viewed as the most closely aligned with trends in the global economy. Copper and other commodities have been lagging behind global stocks over the past year (largely owing to a stronger dollar and weakness in Chinese stocks). This week's plunge in copper, however, finally caught the world's attention, and not in a good way. Chart 1 shows the price of spot copper plunging this week to the lowest level since October 2011. It had already fallen below the lower line of a long-term "symmetrical triangle" which signaled that its trend was weakening. One of the worst performing stocks is tied to copper. Chart 2 shows Freeport McMoran Copper & Gold (FCX) tumbling to a two-year low this week. Its relative strength line (gray area) had been falling for the past year. [FCX is primarily a copper stock]. The copper breakdown calls into question the strength of the global economy which, in turn, is causing nervous profit-taking in global stock markets.


