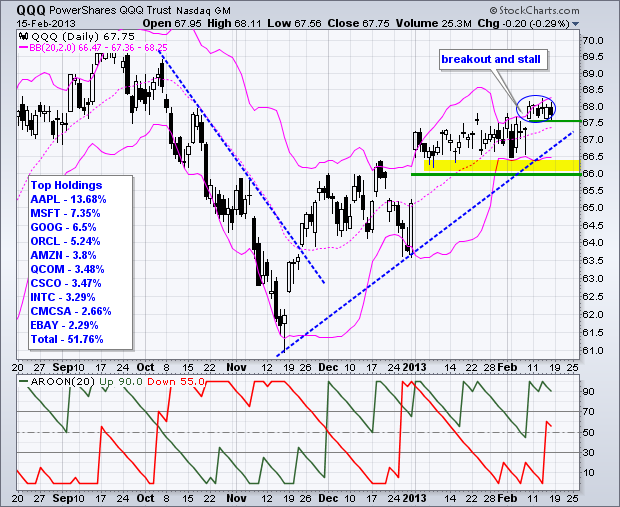
The Nasdaq 100 ETF (QQQ) just can't seem to find its mojo this year, but the 2013 trend is still up and the bulls still have the edge, albeit a slight edge. First, note that QQQ has been trending higher since mid November. A three month uptrend means the medium-term trend is up, which establishes the path of least resistance. Second, QQQ stalled the first six weeks of the year and the Bollinger Bands narrowed significantly in early February. A Bollinger Band squeeze signals a volatility contraction that can lead to a volatility expansion.

Click this image for a live chart
It looked like the bulls were taking control when QQQ gapped up and broke resistance six days ago, but the ETF went right back into stall mode after this breakout. Looks like the volatility expansion has been put on hold. Technically, the breakout is holding because the gap has yet to be filled. After holding 67.50 for six days, a close below this level would provide the first sign of trouble. Medium-term, the January-February lows mark key support in the 66-66.50 area. Also notice that Aroon Up (green) remains above Aroon Down (red), although Aroon Down moved above 50 this week. A bearish Aroon cross would put another straw on the bull's back. You can read more about the Bollinger Band Squeeze and Aroon indicators in our ChartSchool.
Enjoy the long weekend!
Arthur Hill CMT

About the author:
Arthur Hill, CMT, is the Chief Technical Strategist at TrendInvestorPro.com. Focusing predominantly on US equities and ETFs, his systematic approach of identifying trend, finding signals within the trend, and setting key price levels has made him an esteemed market technician. Arthur has written articles for numerous financial publications including Barrons and Stocks & Commodities Magazine. In addition to his Chartered Market Technician (CMT) designation, he holds an MBA from the Cass Business School at City University in London.
Learn More