Hello Fellow ChartWatchers!
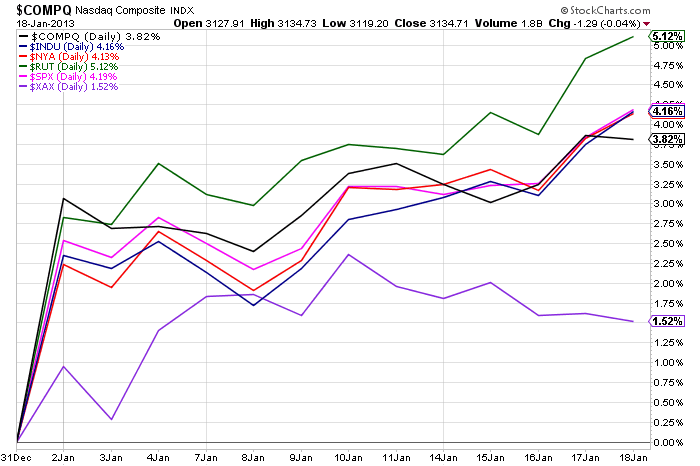
So far, 2013 is proving to be very interesting with bullishness dominating the stock market so far. Since the start of the year, most of the major US market averages are up over 4% with the Russell 2000 (+5.12%) leading the way.
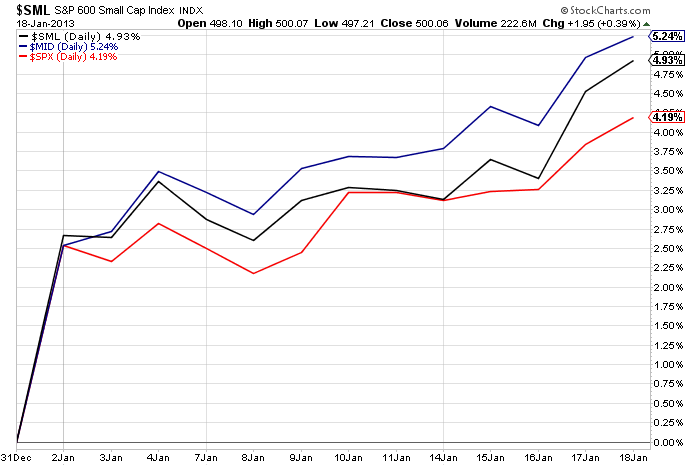
Looking at the market capitalization PerfChart, we see that everything is positive with the S&P 400 Mid-Caps (+5.24%) posting the largest gain.
On the S&P Sector side of things, everything is up however technology and utility stocks are significantly lagging the other sectors.
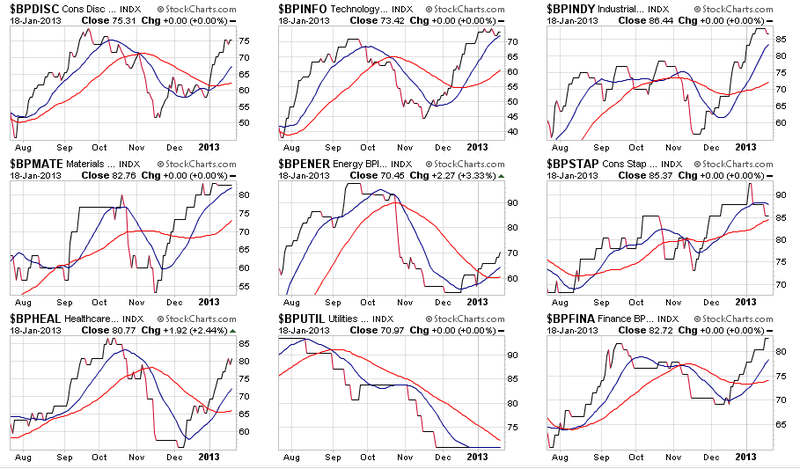
Looking at the Bullish Percent Index charts for the 9 S&P sectors, the 20-day averages for all sectors are currently moving upwards with the exception of the Utilities sector. Given that Utilities are a proxy for the Bond market and that Bonds generally move in the opposite direction to Stocks, this is more confirmation that money is moving back into stocks right now.
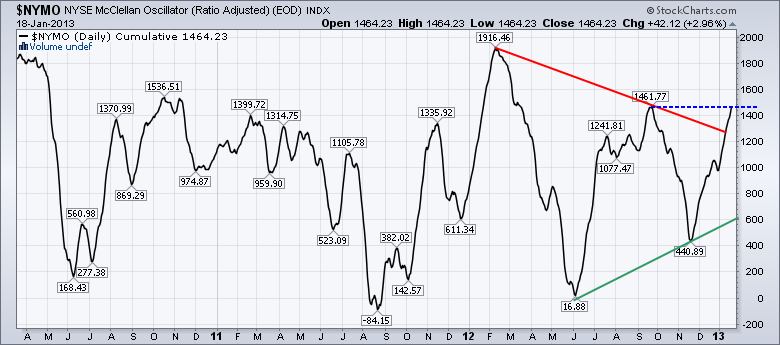
Finally, the McClellan Summation Index has just moved above its previous mid-September peak, further confirming that it is currently in an uptrend (green line).
Bottom line, stocks are current bullish.
Now, do you know how to create the charts above? Did you know that such tools existed on our website? Are you confident that you are getting everything possible from your StockCharts.com membership?
If the answer to those questions is "No" then please consider attending one of our upcoming live StockCharts University seminars. The first course, "SCU 101: Getting the Most Out of StockCharts.com" shows you exactly how to perform the top-down analysis I show above allowing you to always know where the market is heading.
But don't take my word for it. Here are some actual quotes from several of the people that attended our Dallas seminar which was held just last weekend:
"If I had left before lunch, I would have received more than full value for the cost." - C.B.
"I thought that I would pick up a few useful ideas from the seminar, but in fact learned much more than I anticipated. I came away from the course realizing that there were many useful features of the website that I was not fully utilizing to their fullest extent, and to my best advantage." - B.D.
"I learned how to make a scan that immediately paid for the class and entire weekend in the next week of trading. I strongly recommend the class." - D.J.
"If charts and technical analysis is your thing, the Stockcharts seminar is a day well spent." - P.C.
Again, I love presenting at these seminars and hope I can see you at one of them soon. This year we will be holding seminars in Orlando, Long Beach, Seattle, New York, and Toronto. The Orlando one is coming up fast and would be a great excuse to escape to Florida next month! Click here for more information.
- Chip


