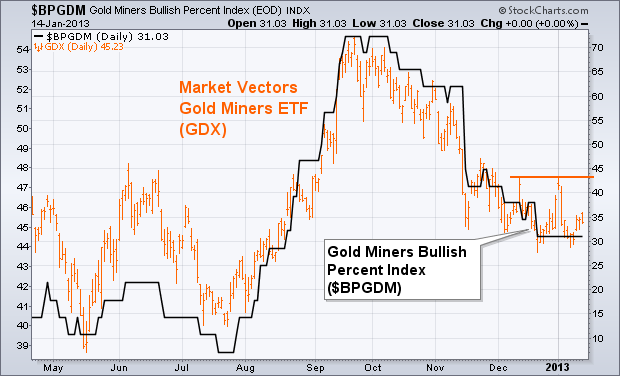
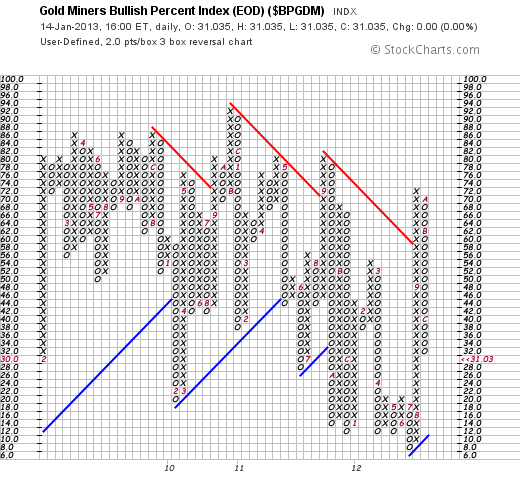
Whenever we look at gold, it's a good idea to check on the trend of gold miners. The orange bars in Chart 1 show the Market Vectors Gold Miners ETF (GDX) still in a downtrend, but trying to stabilize. The first thing the GDX needs to do to improve its short-term trend is to clear initial resistance near 47.50 (orange line). It also needs to see stronger chart action in individual gold mining stocks. The black line plots the Gold Miners Bullish Percent Index ($BPGDM), which measures the percent of gold miners in point & figure uptrends. That line has been in a downtrend since October. It needs to see an upturn to support any meaningful rally in the GDX. The BPGDM has been flat-lining at 31. It would need to rally to 38 to signal a possible upturn. Chart 2 shows why. The most popular way to track turns in the Gold Miners BPI is with a point & figure chart which is shown in Chart 2. The X column shows an uptrend, while the O column marks a downtrend. Each box is worth 2 points. In order for the current down (O) column to achieve a three-box upside reversal and start a new X column, it would have to rise to 38. An upturn in the GDX would support any potential upturn in the price of gold.


