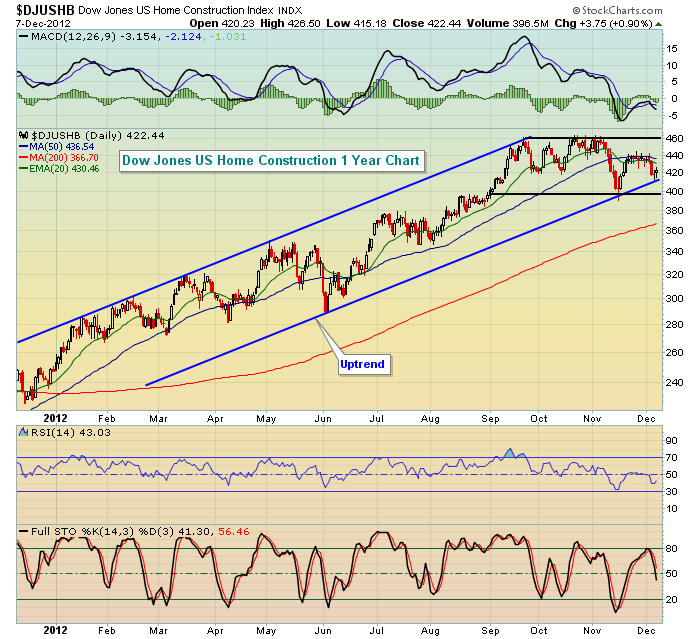
Homebuilders have been a leading industry group throughout the S&P 500 rally off the 2009 lows. This strength has been particularly obvious over the past year. Looking strictly at a shorter-term chart, technical indicators couldn't look much better. Check it out:

While homebuilders did fall below their 50 day SMA a month ago and the most recent attempt to move back through that 50 day SMA failed, it looks strikingly similar to what we saw in early June, just before a huge 27% one month rally. Trendline support continues to hold. In addition, homebuilders consolidated in a short-term base in late August before breaking above 400. The most recent selloff held support at 400 before rallying to test 50 day SMA resistance from underneath. I'm eventually looking for this group to break to fresh new highs, possibly even before year end.
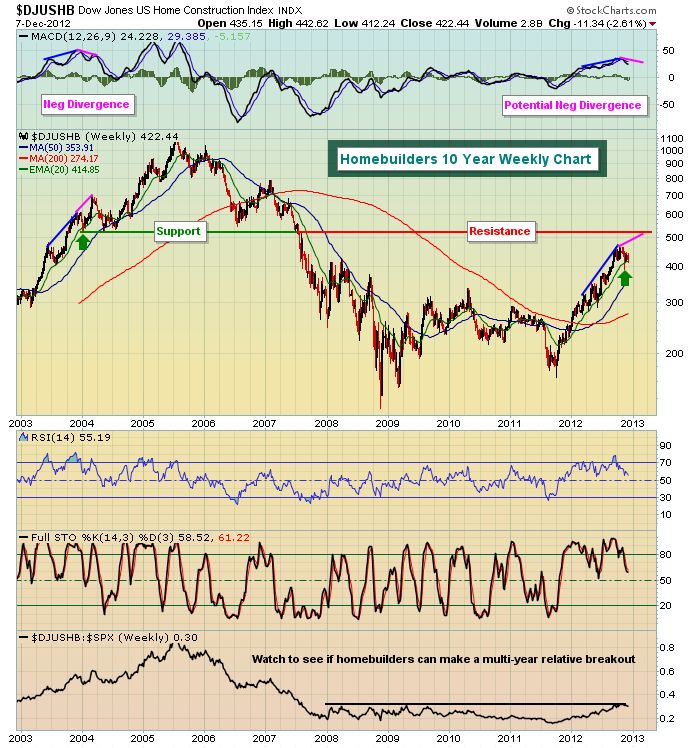
The short-term chart is not what's bothering me. Instead, it's the long-term weekly chart where warning signs are just now starting to show. Take a look at this 10 year chart:

The current technical pattern is quite similar to late 2003. On the next high, in early 2004, a long-term negative divergence fomed and more significant selling followed. On the chart above, I've indicated that with the next push higher in the price of the $DJUSHB, a long-term negative divergence is likely to print. That is indicative of slowing momentum in the longer-term. Generally, more significant selling follows.
I'm not quite ready to write off homebuilders. In fact, I'm expecting them to lead at least one more push higher in equities. After that move, however, we'll need to re-evaluate and perhaps lower our expectations for this industry.
Happy trading!
Thomas J. Bowley
Chief Market Strategist
Invested Central
http://www.investedcentral.com/

While homebuilders did fall below their 50 day SMA a month ago and the most recent attempt to move back through that 50 day SMA failed, it looks strikingly similar to what we saw in early June, just before a huge 27% one month rally. Trendline support continues to hold. In addition, homebuilders consolidated in a short-term base in late August before breaking above 400. The most recent selloff held support at 400 before rallying to test 50 day SMA resistance from underneath. I'm eventually looking for this group to break to fresh new highs, possibly even before year end.
The short-term chart is not what's bothering me. Instead, it's the long-term weekly chart where warning signs are just now starting to show. Take a look at this 10 year chart:

The current technical pattern is quite similar to late 2003. On the next high, in early 2004, a long-term negative divergence fomed and more significant selling followed. On the chart above, I've indicated that with the next push higher in the price of the $DJUSHB, a long-term negative divergence is likely to print. That is indicative of slowing momentum in the longer-term. Generally, more significant selling follows.
I'm not quite ready to write off homebuilders. In fact, I'm expecting them to lead at least one more push higher in equities. After that move, however, we'll need to re-evaluate and perhaps lower our expectations for this industry.
Happy trading!
Thomas J. Bowley
Chief Market Strategist
Invested Central
http://www.investedcentral.com/

About the author:
Tom Bowley is the Chief Market Strategist of EarningsBeats.com, a company providing a research and educational platform for both investment professionals and individual investors. Tom writes a comprehensive Daily Market Report (DMR), providing guidance to EB.com members every day that the stock market is open. Tom has contributed technical expertise here at StockCharts.com since 2006 and has a fundamental background in public accounting as well, blending a unique skill set to approach the U.S. stock market.
Learn More