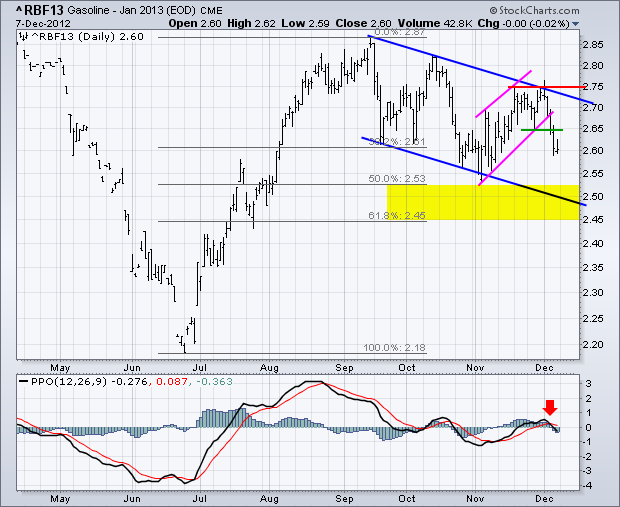
Gasoline Jan13 (^RBF13) formed a lower high and broke support with a sharp decline this week. First, notice that the trend since mid September is down with a series of lower lows and lower highs taking shape the last few months. This week's breakdown signals a continuation of the medium-term downtrend and targets a move to the lower channel trend line. Potential support in the 2.50 area is confirmed by the 50-62% retracement zone. The indicator window shows MACD turning bearish with a move below its signal line and into negative territory. ETF traders can refer to the US Gasoline Fund (UGA).


Click this image for a live chart.
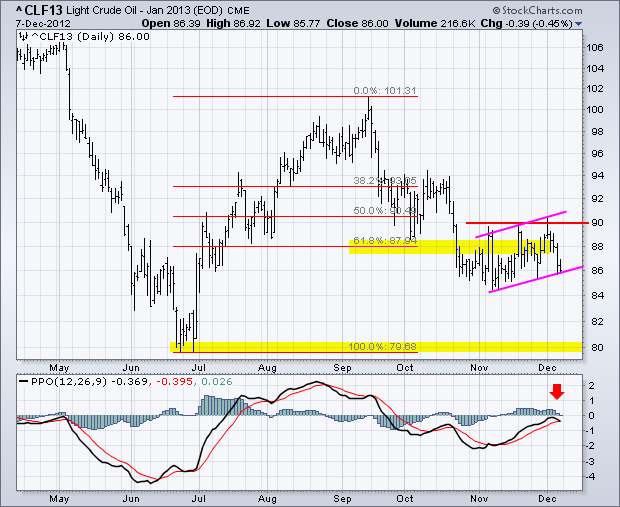
Light Crude Jan13 (^CLF13) is also sporting a bearish setup. Note that the overall trend since mid September is down. Crude is attempting to firm in the 85-90 area, but cannot break 90 to reverse the downtrend. A breakout, and close, above 90 would be medium-term bullish. Barring a breakout, note that crude formed a bear flag over the last six weeks. Flags are continuation patterns. Bearish flags slope up and bullish flags slope down. A break below flag support would signal a continuation lower and target a move to next support in the 80 area. ETF traders can refer to the US Oil Fund (USO).
