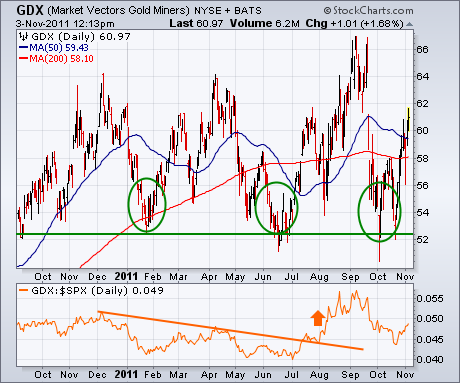
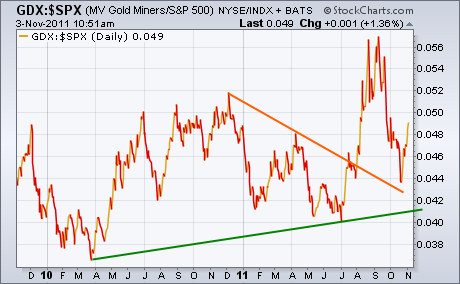
My Market Message from Tuesday of last week (October 25) wrote about new signs of strength emerging from an oversold gold-mining group. It showed the Market Vectors Gold Miners ETF (GDX) bouncing off chart support along its 2011 reaction lows (see circles in Figure 1). In Thursday's trading, the GDX has moved back above its 50- and 200-day moving averages for the first time in three months. The GDX/SPX relative strength ratio (below Figure 1) is starting to bounce again as well. The upturn in the ratio took place in early August when the stock market started to weaken. After pulling back during the October stock market rally, the ratio is starting to bounce again. Chart 2 shows a longer version of the GDX/SPX ratio. The rising green trendline shows that the longer-range trend of the ratio is still up. The breaking of the falling trendline drawn over the December/April highs is also a positive sign.


