Over 10 years ago I developed an indicator called Dollar-Weighted Volume (DWV). It could be that I reinvented the wheel, but I am not aware of anyone else who uses this indicator. DWV is variation of On-Balance Volume (OBV), which was developed by Joe Granville. DWV is calculated by multiplying the daily volume of each stock in a given market index by the closing price, then adding (or subtracting, if the stock closes down) the result to the cumulative total of DWV for the index. The resulting indicator is an expression of the trend of money rather than just volume.
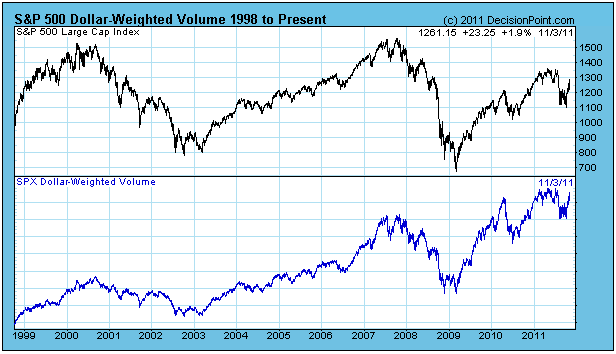
DWV is a short-term indicator. On the chart below we show the SPX version, and you will note that the DWV and the price index run pretty close together, with tops confirming tops and bottoms confirming bottoms. What we look for are positive/negative divergences and for instances where volume doesn't confirm price, meaning that volume either leads or lags price. When this happens, look for a change in the short-term price trend.
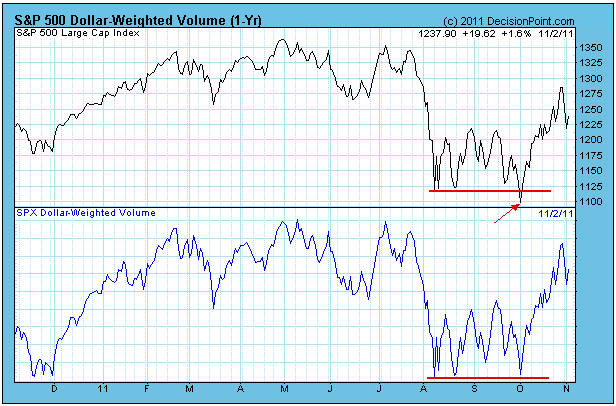
The annotation on this first chart shows how DWV failed to make a lower low along with price (negative divergence), indicating that DWV was beginning to dry up during the selloff.
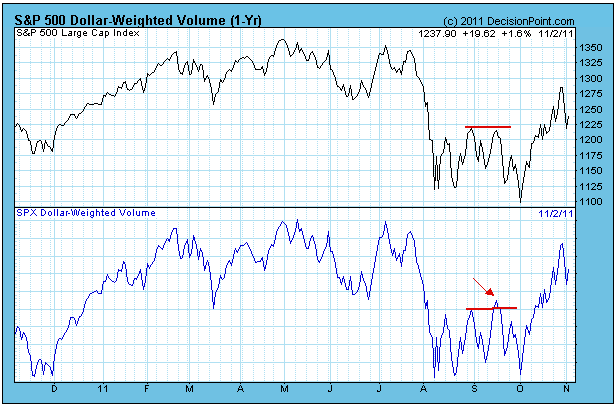
The annotations on the next chart shows price making a lower top compared to DWV making a higher top. This represents a minor blowoff as prices fail to respond to higher volume. This goes contrary to the belief that volume leads price.
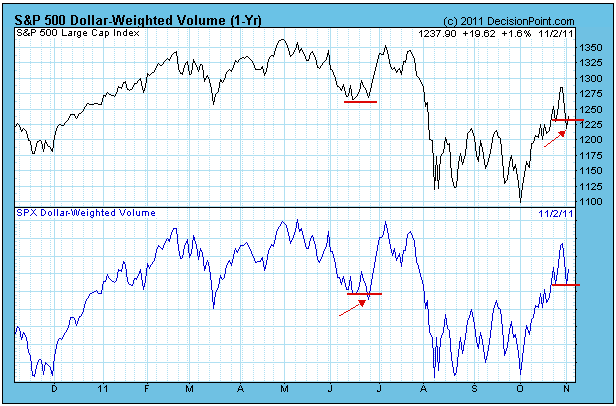
The next chart shows a minor blowoff to the downside in June. More recently we have price making a low beneath the prior low, but this is not confirmed by DWV (positive divergence). This implies that price will continue trending upward in the short term (days to weeks).
I think that DWV is only good for short-term comparisons because it has an upward bias over the longer term. Note above that the December price lows are higher than the August through October price lows, whereas the comparable DWV lows are equal. That could be interpreted as a positive divergence, but it could simply be a symptom of the upward bias. The long-term chart below clearly demonstrates the upward bias.

Bottom Line: Dollar-Weighted Volume is a unique indicator because it expresses volume in terms of dollars, and it can be a handy tool for identifying short-term price trend changes. Beside giving us positive and negative divergences, it can also alert us to times when blowoff conditions exist, cases when leading volume is actually signalling a trend reversal.


