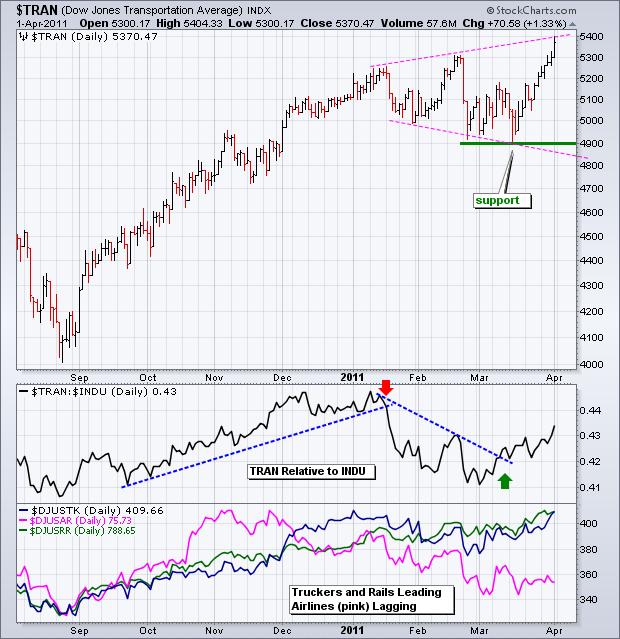
Despite relative weakness in airlines and $108 oil, the Dow Transports surged to a fresh 52-week high on Friday. The chart below shows the Average finding support around 4900 from late February to mid March and then surging around 10% the last 2-3 weeks. Admittedly, there is an outside chance that a broadening formation is taking shape, but the Average shows no signs of significant selling pressure at the moment.

Click this image for a live chart
In the first indicator window, we see the Dow Transports relative to the Dow Industrials. This indicator is the Price Relative, which is a ratio chart of the two Averages ($TRAN:$INDU). The Price Relative rises when the Transports outperform and falls when the Transports underperform. The ratio is currently rising as the Transports outperform. The second indicator window shows three key groups within the Dow Transports: Truckers (blue), Railroads (green) and Airlines (pink). Coal-laden Railroads are leading the way with a 52-week high this week. Truckers are challenging their 2011 high. Airlines are the current laggards.
