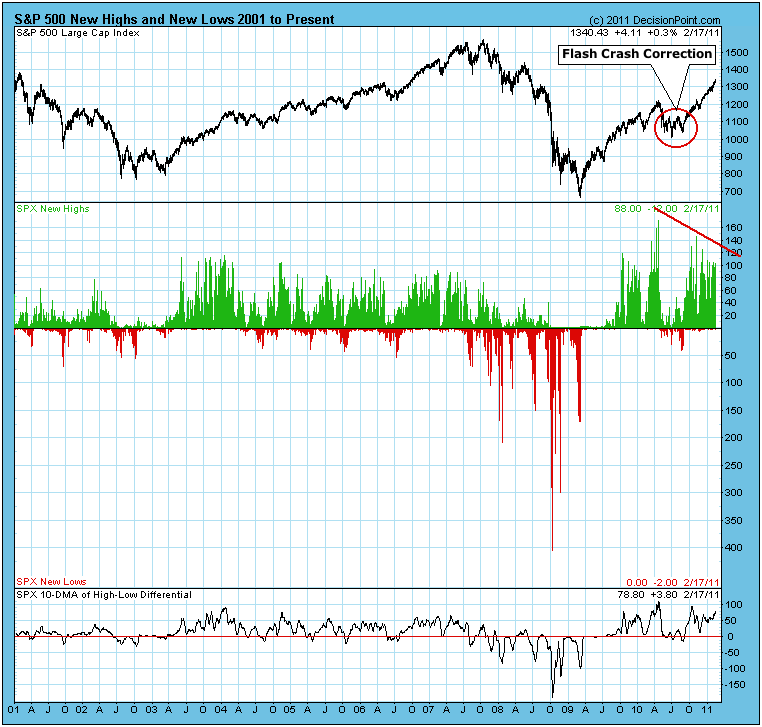
The daily number of New Highs and New Lows (NHNL) refers to stocks reaching their highest or lowest price during the most recent 52-week period. Below is a NHNL chart for the stocks that compose the S&P 500 Index, and we can learn a few things from it.
First, we can see that the main problem is that new highs are contracting as prices move higher. This is a negative divergence and is also almost certain to be a setup for a price decline.
Another feature on this chart is that the new high structure for this bull market is much more massive than at any time during the 2002-2007 bull market. Even though they represent a contraction from earlier new highs, the most recent new high readings are nearly as high as the highest new high readings of the the preceding bull market. This attests to the strength of the market rebound off the bear market lows in 2009.
Note also that the price advance from the 2009 low has taken about half the time as the same amount of price gain took during from the 2002 lows -- we're talking 22 months versus 54 months. Again, this has been a very powerful move.
Another thing I wanted to mention -- something that has nothing to do with the subject of NHNL -- is the Flash Crash Correction. I have named it thus because I believe that its depth and duration were more exaggerated than they would have been were it not for the Flash Crash. In hindsight we can see that this event took place in the middle (so far) of a strong bull market. Notably, there was no significant deterioration before hand that could have given us a credible warning. We are told that it can't happen again. I wonder.
Bottom Line: New highs are presenting a negative divergence, but the level of new highs remains very high, and the strength of the price advance better than normal, in spite of the Flash Crash Correction. Corrections are inevitable, but there is no indication that the next correction will be unusually difficult.

