One thing that's been quite apparent to me over the past several months is that money is not leaving the equity market. When one sector or industry group sells off, the money simply rotates elsewhere. Then rinse and repeat. This is truly a trader's dream because there are almost always opportunities to find low risk, high reward plays. It's as simple as using the StockCharts scan engine to find stocks in patterns that afford us great opportunities.
I like to take a top down approach. I first look at the overall market and the indicators I use to determine the intermediate- to long-term health of the stock market. Those indicators have been bullish for months and remain that way. The next step is to ignore the temptation to short stocks because they "seem" like they're priced too high. The market has priced them there for a reason and as long as momentum remains bullish, I don't argue with the market. My third step is to review the various sectors and subsectors, trying to identify groups that are beginning to lead on a relative basis OR groups that have previously led and have pulled back to key support levels or moving averages.
To give you an example, I sent our daily Market Chatter out on Thursday, February 10th. Here was an excerpt:
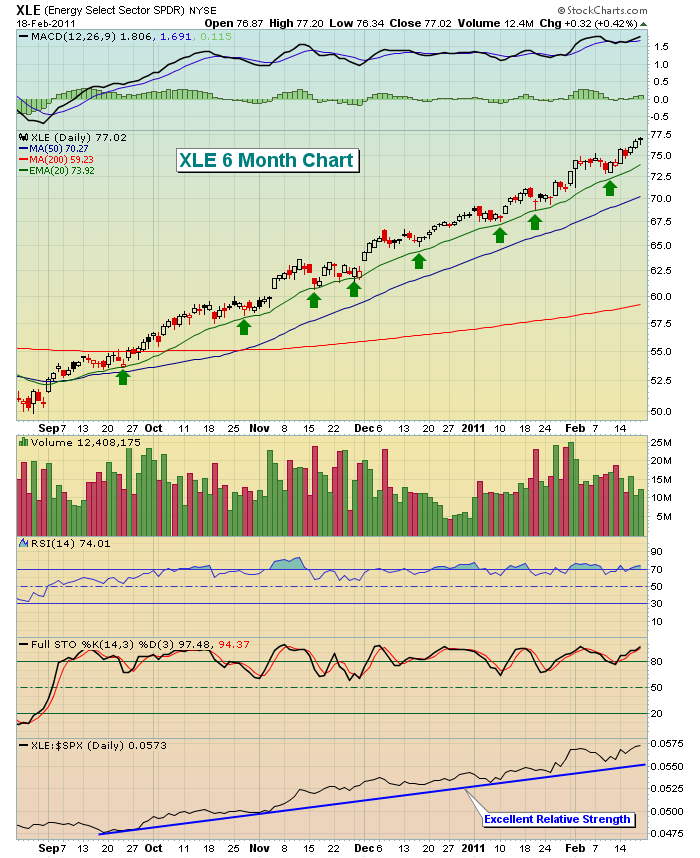
"Energy (XLE) has been showing relative weakness of late, but it's a sector that has not seen a close beneath its 20 day EMA since August, a very powerful trend. This morning, the XLE is trading at 72.83 in pre-market (at last check). Its 20 day EMA is currently at 72.10. So for those who would like a more conservative position, consider trading the XLE as it approaches its 20 day EMA. If it fails to hold, exit with a fairly small
loss."
The XLE printed a bullish engulfing candle that day, just above its 20 day EMA and hasn't looked back since. Now take a look at the XLE chart and I'll explain what I saw:
Note first that the relative strength of the XLE was quite strong, rising against the S&P 500 for months. This clearly indicated to me that energy had bullish momentum on its side. Any time I can jump on a sector like this when it's "on sale", I'll take advantage.
Just before the XLE hit that short-term bottom, we provided a setup on Hornbeck Offshore Services (HOS) - they provide specialty services to the offshore oil and gas exploration and production industry. We liked the group and also the technicals at the time. HOS is featured as our Anatomy of a Trade for this week. CLICK HERE for more information on this setup and its subsequent performance.
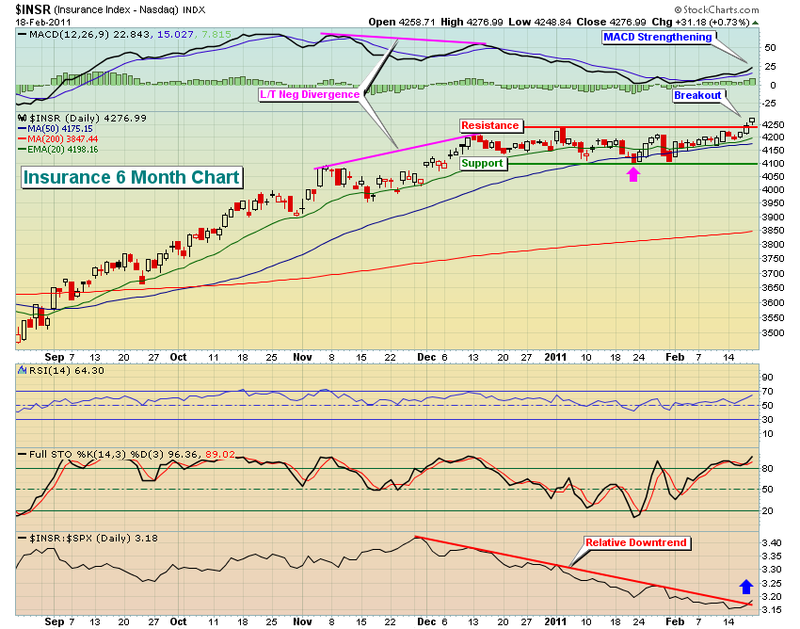
As I look forward, I really like the action in the NASDAQ Insurance Index. Take a look at the following chart:

A solid period of consolidation helps to set up a more bullish move upon breakout. That's what has transpired here. Insurance was outperforming the S&P 500 until late in 2010. That's when a nasty long-term negative divergence formed. Astute traders bailed on the group as insurance consolidated (and underperformed) over the next two months. The price breakout late last week was encouraging, as was the relative downtrend breakout. This is a group that is likely to see more buying in the near-term. I am focusing on this industry group in this weekend's stock setups for our members.
Invested Central is hosting three events this week, beginning with a FREE "Meet Invested Central" event on Monday, February 21. I'll be joined by my partner John S. Hopkins, Jr. as we discuss our services and methodology and our approach to education (among other things). CLICK HERE to register and for more information.
Happy trading!

