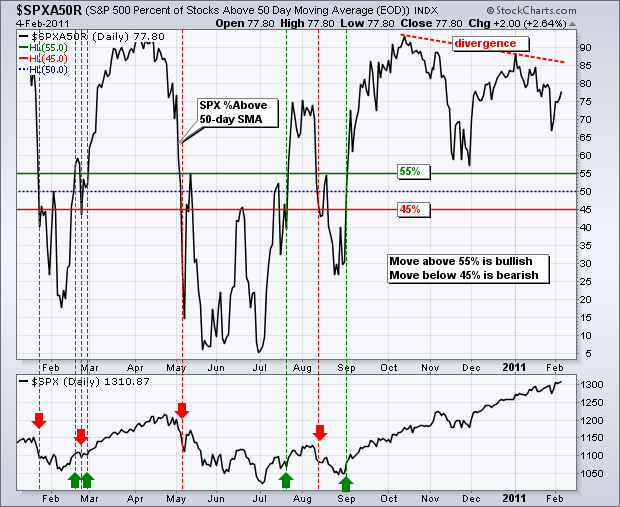
The S&P 500 %Above 50-day SMA ($SPXA50R) indicator is a breath gauge that measures the degree of participation. In this instance, the indicator tells us the percentage of S&P 500 stocks that are above their 50-day SMAs. In general, a bullish bias exists when more than 50% are above their 50-day SMAs and a bearish bias otherwise (<50%). Using the 50% line to signal shifts can result in whipsaws so it is often helpful to apply a filter. For example, a bullish threshold could be set just above 50% (55%) and a bearish threshold could be set just below (45%). Even though this filter creates a little lag, it reduces the number of signals and whipsaws.

Click this image for a live chart.
The chart above shows the S&P 500 %Above 50-day SMA moving above 55% in early September and remaining in bull mode the last four months. Prior signals are shown with green and red arrows. In fact, the indicator has not even dipped below 55% since this cross. Chartists may notice a bearish divergence from October to January as the indicator formed a lower high and the index pushed to new highs. This shows participation narrowing somewhat. However, keep an eye on the absolute levels. The S&P 500 hit a new 52-week high this week and 77.8% of its components are above their 50-day SMA. This is much less than mid October and early January, but anything above 70% is more than enough to power a rally. The bearish divergence does not show material weakness. It simply shows less strength than before. Look for a move below 45% to reflect actual weakness within the index. See our ChartSchool article for more details.
