I've cautioned recently about the risks of being long in the market. There were too many warning signs. Yes, the market could have kept its head down and pushed to higher levels. But that wouldn't have been the healthy way to extend the recent uptrend. Many of the major indices failed at critical long-term resistance and now must regroup from lower levels as they approach key short-term support levels. I'm featuring a few key indices/ETFs in order to highlight the importance of the resistance levels tested. Check these out below:


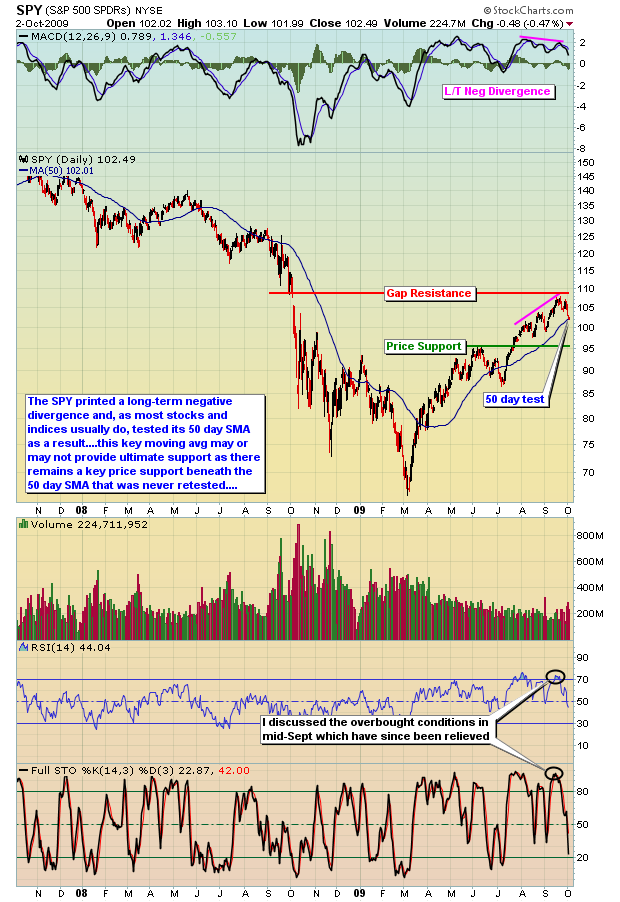
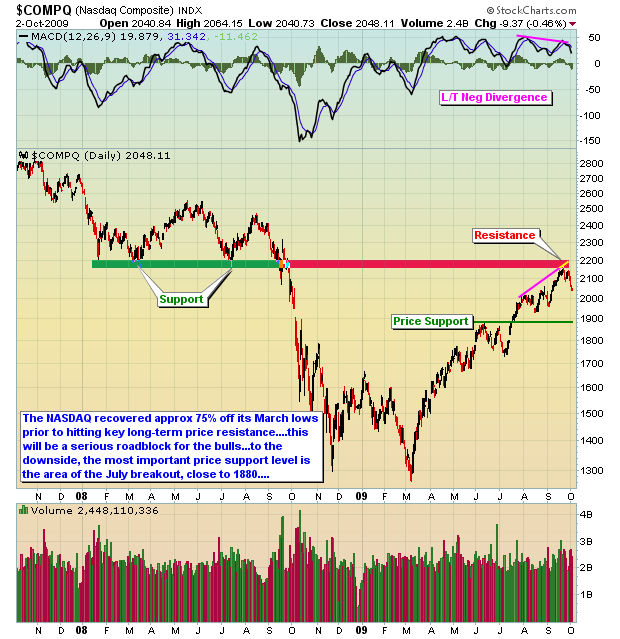
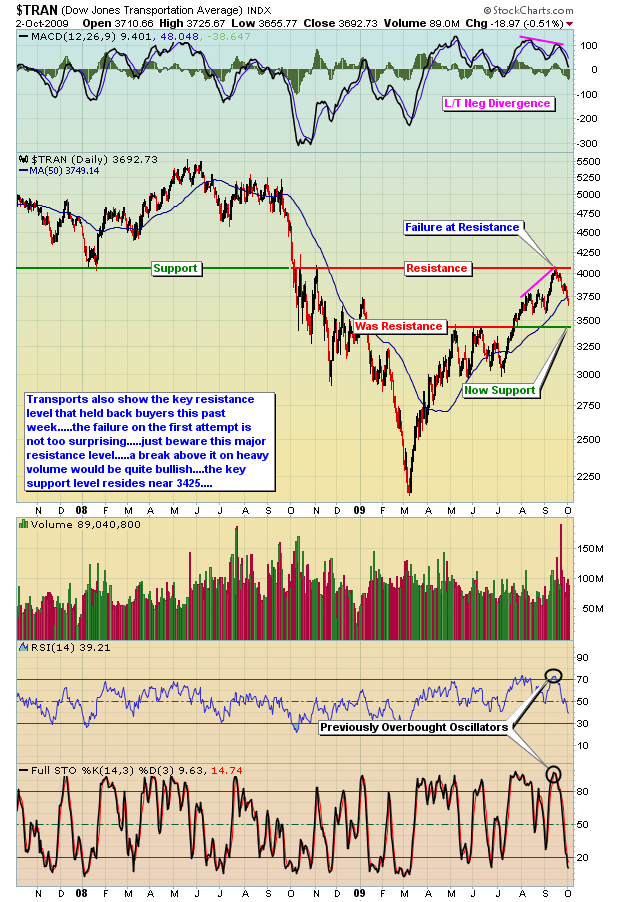
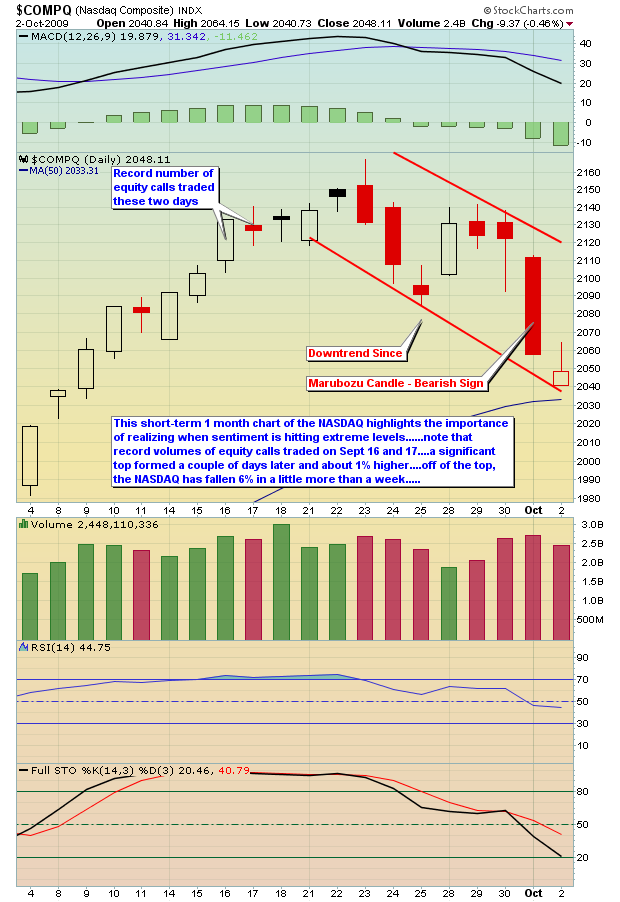
I used the SPY chart above instead of the S&P 500 in order to reflect the gap resistance present on SPY that doesn't appear on the S&P 500 chart. Notice how the price of SPY climbed almost exactly to the top of that gap before failing and rolling over to the downside. Sellers were lined up at that level, knowing full well that a close above gap resistance would likely trigger more short covering and more technical buyers. The failure on this first test should come as no surprise. You can also see that the technology-laden NASDAQ and the economically-sensitive transports also failed at key resistance. Given the recent overbought conditions, negative divergences on the MACD, and complacency readings on the equity only put call ratio, a pullback was very much needed. In my last article, I indicated the record number of equity calls traded on September 16th and 17th. Take a look at the NASDAQ 30 day chart below to understand why following this sentiment indicator is so important. The combination of a very low equity only put call ratio AND the high volume of options traded suggested that an important top was forming, just as it did in early May. While the top didn't occur exactly on September 16th/17th, the market had little fuel in the tank after the extreme complacency readings that were mentioned two weeks ago.

Many of the red flags that have tormented the market the last few weeks have been eliminated, making it easier for the uptrend to resume. However, we must all be aware of the fact that the July breakout occurred from much lower levels and that the 50 day SMA may not necessarily hold as support near-term. A final line in the sand should be drawn at the price level where June highs were eclipsed during the July uptrend. That's your critical price support level.
Happy trading!
