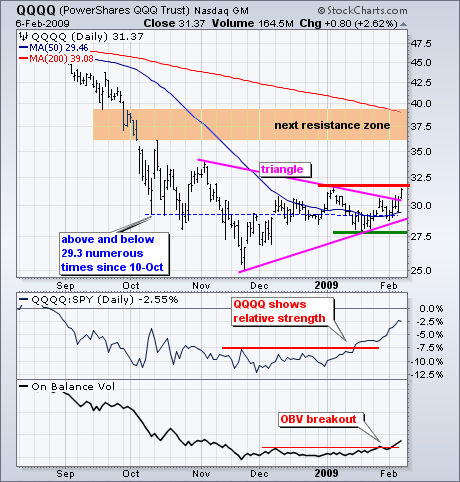
The Nasdaq 100 ETF (QQQQ) is breaking out of its trading range. The chart below shows QQQQ stuck in a trading since 10-Oct. Focusing on the blue dotted line marking the mid October lows, we can see that QQQQ traded above and below this line numerous times the last four months. In essence, QQQQ went nowhere from 10-Oct until early February. A triangle formed from early November as the trading range narrowed over the last two months.
QQQQ could be finding direction now. With an advance over the last five days, QQQQ broke the triangle trendline and is closing in on resistance from the early January high (red line). A breakout here would be quite positive and argue for a counter-trend rally. The big trend remains down, but bear market rallies are perfectly normal. QQQQ could possibly make it to the falling 200-day moving average.
Relative strength and On Balance Volume (OBV) confirm the triangle breakout. The first indicator shows QQQQ relative to SPY. This relative strength comparative rises when QQQQ outperforms SPY and falls when QQQQ underperforms. QQQQ has been outperforming since the second week of January because that is when the relative strength comparative broke resistance. On Balance Volume (OBV) is a cumulative indicator that adds volume on up days and subtracts volume on down days. Granville theorized that volume leads prices. If this is the case, then OBV suggests that QQQQ will break its January high soon. Notice that OBV broke its December and January highs this week.
Click here for a video presentation of this information.

