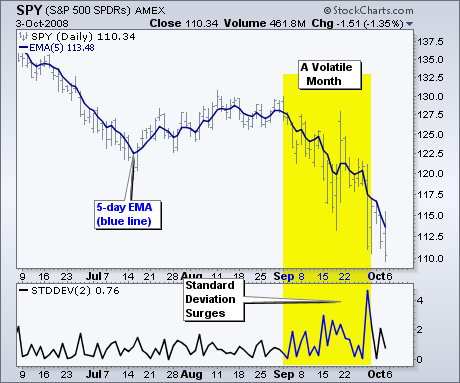
September was one of the most volatile months in recent memory. Bar charts and candlestick charts are great, but the wild high-low swings can interfere with basic trend analysis. Moving averages provide a good means to smooth this volatility by cutting through the daily noise. For those who want it all, a combination of high-low-close bars and a short moving average may even be appropriate. This combination shows the high-low range, but also focuses on average prices to discern a trend.

The accompanying chart shows the S&P 500 ETF (SPY) with bars in gray and a 5-day EMA in blue. Even though September has been exceptionally volatile, the 5-day EMA shows a steady downtrend. In fact, the 5-day EMA does not look any more variable than the prior months. Despite Tuesday's big rebound, this EMA hit a new low to affirm the downtrend that began August.

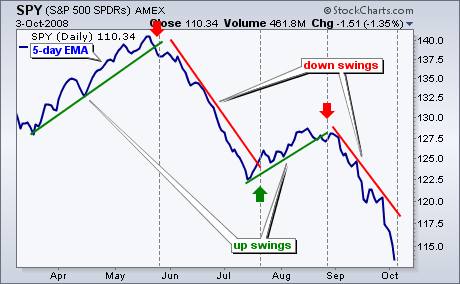
The second chart shows the 5-day EMA without bars or candlesticks. It is a pretty empty chart, but it sure cuts through the clutter. There are four trendlines that denote the swings over the last six months. The current swing is down and the decline even accelerated this week. SPY may be oversold, but it is clearly in the falling knife category as the 5-day EMA dropped over 5% this week. As this trendline now stands, the 5-day EMA needs to move above 119 to reverse this down swing (break the trendline).
There is also a video version of the this analysis available at TDTrader.com - Click Here.
