In my September 19 article I said: "Our indicators and price action suggest strongly that we are beginning a rally that should last at least a couple of weeks. I also think that this week's deep low needs to be retested, and I am not convinced that a retest will be successful." As it turned out, there was no rally and the expected retest and failure encompassed one of the worst one-day declines in history.
From top to bottom the S&P 500 Index has dropped nearly 30%, but as usual we can't turn on financial news without hearing somebody assert that this is now the "buying opportunity of a lifetime". I wish it were, but in my opinion it is not. For it to be that great a buying opportunity stocks would have to have extraordinary fundamental value, and that kind of condition has not existed for over 20 years.
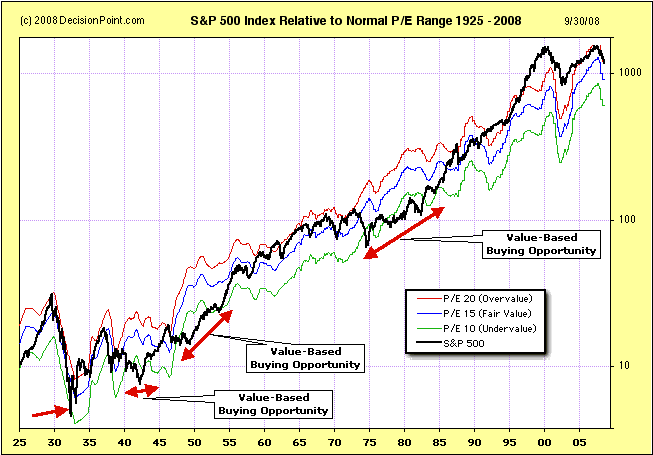
Based upon 2008 Q2 GAAP earnings the P/E of the S&P 500 is about 21, which puts it slightly above the normal P/E range of 10 to 20, meaning that stocks are very overvalued (the exact opposite of being a bargain). To demonstrate, the chart below displays the S&P 500 in relation to its normal P/E range going back to 1925. The S&P 500 is the heavy black line, the red line shows where the S&P 500 would be if it had a P/E of 20 (overvalued), the blue line is if the P/E were 15 (fair value), and the green line represents a P/E of 10 (undervalued).
I have applied red arrows to identify the periods where stocks were truly undervalued, sometimes mouth-wateringly so -- truly buying opportunities of a lifetime. As you can see, current prices are very overvalued, and possibly near the selling opportunity of a lifetime. To those who think this is the time to buy, I must ask, based upon what? Clearly, prices can rise even when stocks are overvalued, but current economic fundamentals makes that outcome a long shot.

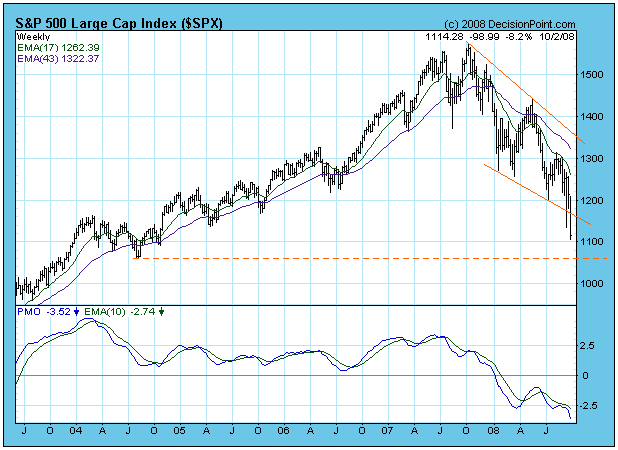
As for our market outlook, the next chart puts the decline in perspective. Prices are deeply oversold, as are many of our technical indicators, so it is reasonable to expect a rally to clear this condition; however, we are in a bear market, and I have no reason to believe that the recent lows are the final bear market lows. There is a 9-Month Cycle trough due around October 22, and it is possible that it arrived early at the recent lows. Otherwise, we should probably look for a bounce followed by a retest of the lows in late-October.

My view of the financial crisis is that it is going to last a long time, and that there will be no easy fix, even if we had some really smart people trying to solve the problem, which we do not. Three weeks ago most congress persons had no more awareness of the problems we are facing than the man on the street. How much confidence do you have that the very people who caused the problem are suddenly going to become smart enough to fix it? In my opinion, they are only going to make it worse.
Bottom Line: Stocks are way overvalued and the economic outlook is dismal. The only long exposure that should be considered is on a short-term basis when the inevitable bear market rallies occur.
