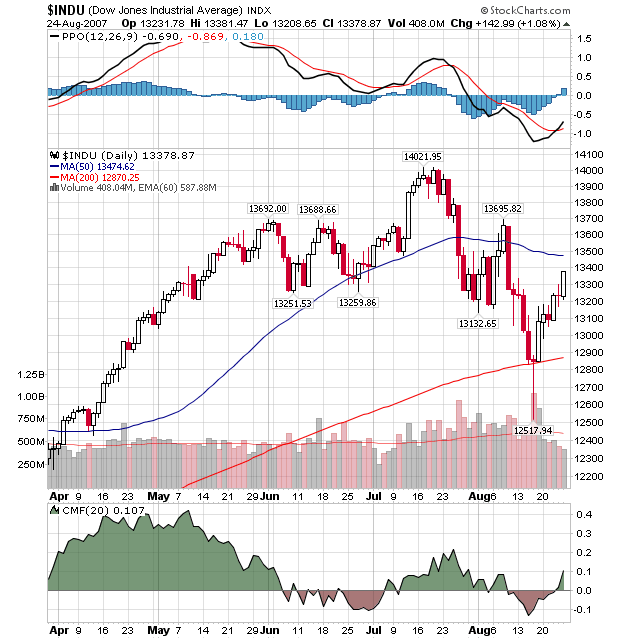
Last week, some significant positive technical developments occurred on our GalleryView chart of the Dow:
After recovering to remain above the 200-day moving the previous week (see the red candle whose shadow dipped all the way to 12,517?), the Dow has rebounded nicely with a nice string of tall white candles. Those candles have managed to turn around the MACD and push the MACD Histogram back into positive territory. In addition, the Chaiken Money Flow (CMF) has also returned to the green side of the ledger.
So is it safe to jump back into the market right now? Well... There is one really big negative on the chart too. Can you spot it? If not, don't worry - John Murphy talks about it in detail below.
The declining market volume that accompanies this rise in prices should give everyone pause. As the Dow closes in on it's 50-day moving average (blue line), expect it to reverse lower unless buying volume increases significantly.

