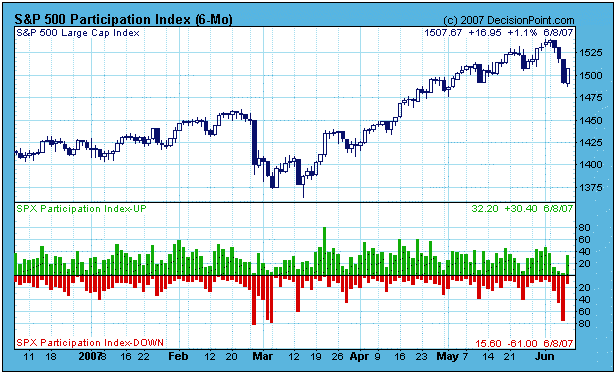
We have been watching prices trend higher for several weeks, even as internal strength trended lower and warned that price weakness could be ahead. Finally, this week prices broke down in a big way, signaling the start of a correction that could last at least a few weeks.
Our first chart is of the Participation Index (PI). The PI measures short-term price trends and tracks the percentage of stocks pushing the upper or lower edge of a short-term price trend envelope. Specifically we track the participation of each stock in a given index. A trend needs a strong plurality of participation to be maintained. We can see how UP participation, the number of stocks actually driving the up move expands as the market moves higher, then the PT contracts prior to short-term market tops. A similar thing, but in reverse, is beginning to happen now with DOWN participation now as the market begins its correction. Note the strong down spike accompanying Thursday's sell off.

While it is always possible that the correction is complete, it is more likely that it will play out somewhat like the February-March correction which is visible on the chart. In other words, it could take a couple of weeks and several tests of support before the rising trend resumes.
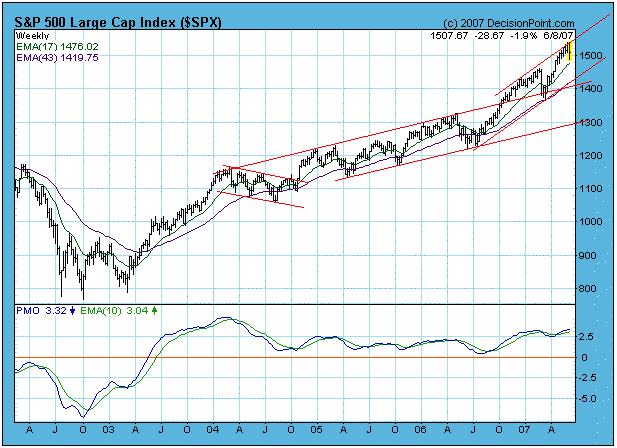
The next chart puts the correction in a long-term context. We can see that prices are dropping down from the top of a rising trend channel, and support will be encountered at around 1430. As long as that support holds, no serious technical damage will have occurred. It is reasonable for us to expect that the current selling is temporary and that the up trend will resume.

Bottom Line: While we are experiencing a short-term correction, I have no reason to believe that the longer-term rising trend is in jeopardy. While corrections are uncomfortable to ride out, they are healthy and necessary, and we should hope this one builds a strong base for the next rally.
