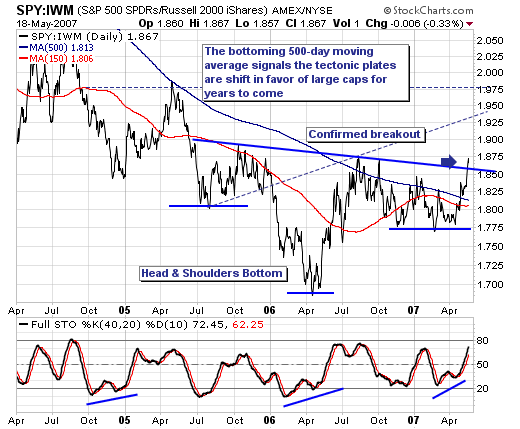
We recently featured the S&P 500 Large Cap vs. Russell 2000 Small Cap ratio surrogate using the ETFs SPY:IWM; with the implication that the tectonic plates were shifting beneath the markets, with large caps slowly, but surely coming back to favor at the expense. This was simply the thesis based on "looking through" out indicators; however, last week provided clear confirmation that indeed - a major breakout had taken place on the daily as well as the weekly and monthly charts. Obviously, this has major implications for our trading strategy; we are increasingly likely to trade the Pfizer's (PFE) or Cisco's (CSCO) or General Electric's (GE) of the world rather than small stocks.

Analyzing the SPY:IWM daily chart once again and keeping it rather simple; we find prices bottomed in April-2006, with the "right shoulder" of a larger "head & shoulders" bottoming formation breaking out above the major 500-day moving average resistance level, and then above neckline resistance. Moreover, the stochastic pattern is supportive of further gains. This breakout could not be cleaner... nor clearer; hence our confidence level is quite high that rotation in favor of large caps will come from the small cap area. Keeping it simple again; one must trade accordingly.
