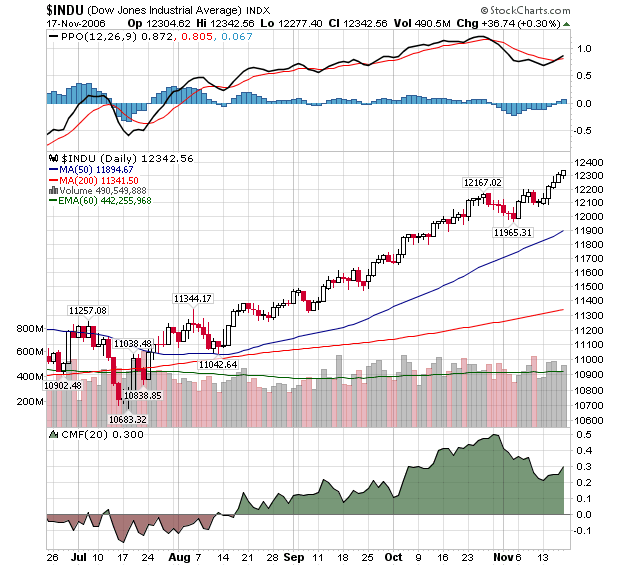
Here's what a strong techincal picture looks like:

Record closes for each of the past 4 days. Steady volume. Increasing Money Flow values. Quick recovery from a recent downturn. Bullish MACD cross-over. This chart has it all!
Unless...
Maybe too many good signs is a bad sign. Maybe this baby is too "overbought" and is due for a correction. Things cannot possible get any better, right?
This is the classic problem that investors face during a bull market. Reversed, this is the same dilemma that they face in a bear market too. However, this is really NOT a problem for disciplined technical analysts. The charts are good and therefore you buy (or hold). Period. End of discussion. End of doubt.
Now sure, you watch carefully for changes in the charts and you move your stop loss levels accordingly. But until the chart changes - until your trendline is broken or your indicator turns down, you just enjoy the ride. Done correctly, Technical Analysis should remove fear and doubt from your investing, not add to it.
