ChartWatchers May 20, 2006 at 10:04 PM

QQQQ established support at 40 with three bounces over the last six months and broke this key support level with a sharp decline over the last two weeks. The break below 40 signals a major victory for the bears and the first downside target is to around 37-38... Read More
ChartWatchers May 20, 2006 at 10:03 PM
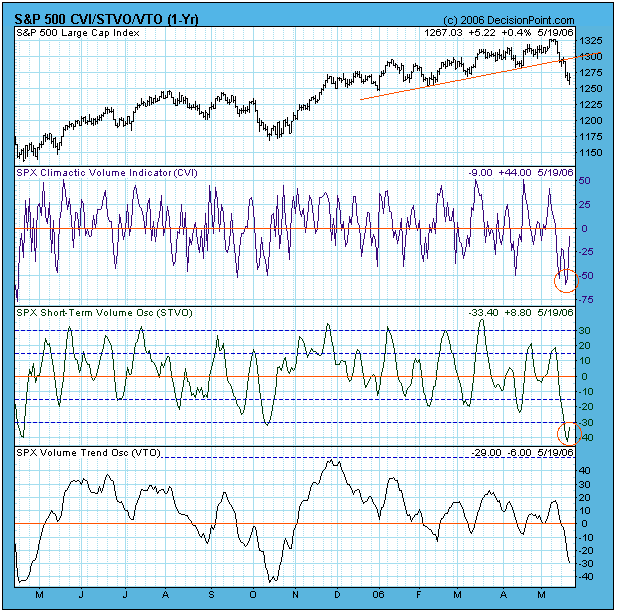
During the last two weeks the market has experienced a much needed (and long anticipated) decline, and now it is due a bounce out of a short-term oversold condition; however, the decline could continue for a few more months... Read More
ChartWatchers May 20, 2006 at 10:01 PM
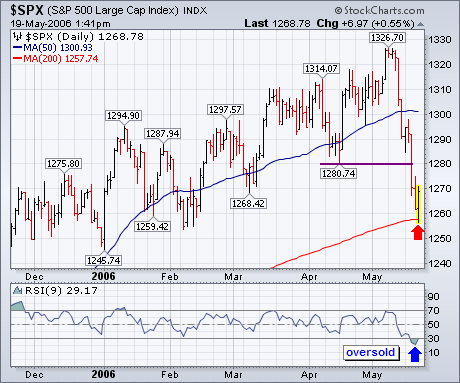
Although the longer-range chart picture has weakened (with most weekly indicators on sell signals), the S&P 500 has lost about 5% this week and looks to be in a short-term oversold condition. Its daily chart shows the 9-day RSI line below 30 for the first time this year... Read More
ChartWatchers May 20, 2006 at 10:00 PM
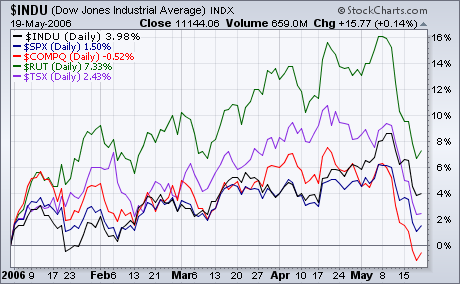
The markets moved lower last week with some disturbingly large downward movements. As you can see in the chart below, last week's losses put the Nasdaq Composite into negative territory for the year - the first of the major averages to get there... Read More
ChartWatchers May 06, 2006 at 10:05 PM
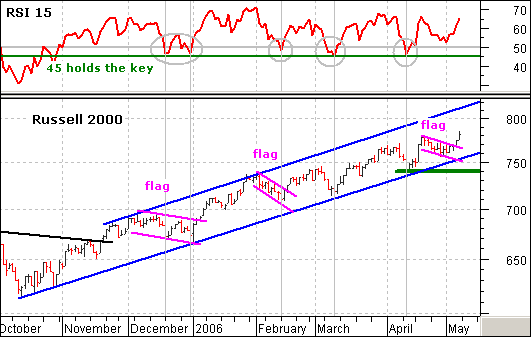
The Russell 2000 has not been the strongest broad index over the last few weeks, but it is still by far the strongest index in 2006 and shows no signs of stopping after another falling flag breakout on Thursday... Read More
ChartWatchers May 06, 2006 at 10:04 PM
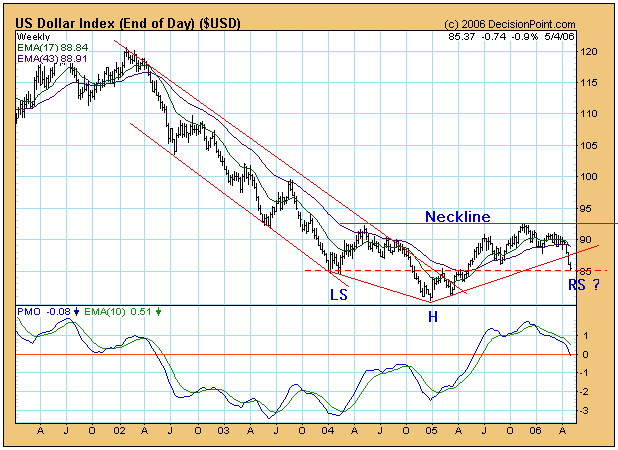
On March 17 our trend model turned from bullish to neutral on the US dollar, and since then the technical picture has continued to deteriorate... Read More
ChartWatchers May 06, 2006 at 10:02 PM
SHARPCHARTS2 OFFICIALLY RELEASED - Late last week we officially released SharpCharts2. This is a huge step forward for StockCharts.com and we couldn't have done it without the help and support of our users... Read More
ChartWatchers May 06, 2006 at 10:01 PM
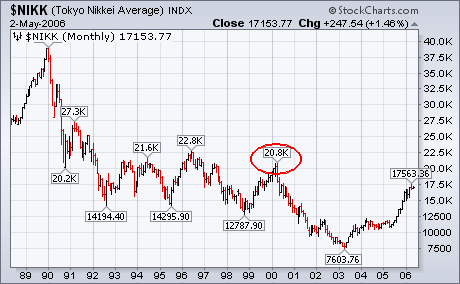
The first chart below shows why I believe Japan to be one of the best global values. While most other global markets are at or near record highs, the Nikkei 225 has recovered barely a third of its losses from 1990 to 2003... Read More
ChartWatchers May 06, 2006 at 10:00 PM
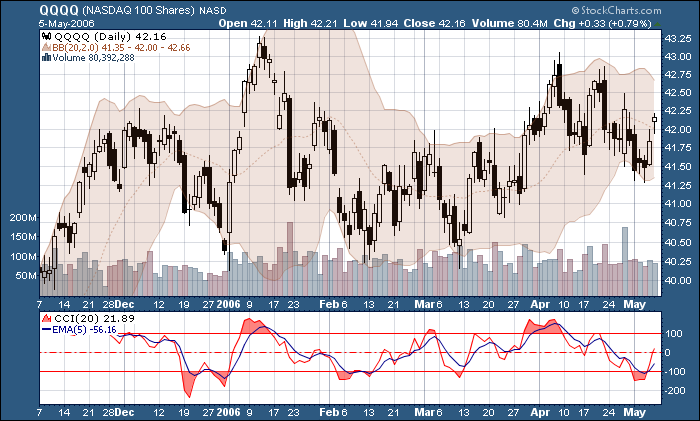
SIGNAL LINES GALORE One of the huge new features of SharpCharts2 is its ability to plot "indicators of indicators... Read More