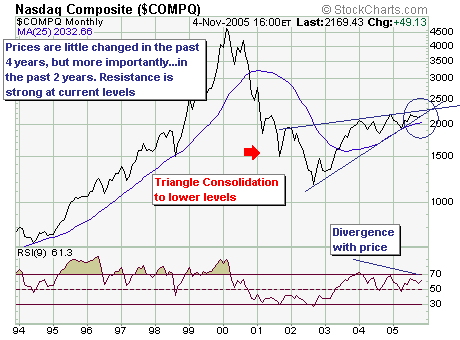
On a longer-term monthly basis, the Nasdaq Composite is very clearly forming a rather bearish "wedge" pattern. Resistance between 2080 and 2220 is quite strong, and rallies back into this zone are becoming weaker and weaker. Ultimately – and we think rather soon, this pattern will lead to lower prices...and perhaps sharply lower prices. Certainly the probability will have increased, and will initially be confirmed once prices decline through wedge support at 2098, and then through of the 25-month moving average at 2032. Then, and only then can we say with any confidence a ravaging bear market is upon us...and it is far closer than one would think.


About the author:
Chip Anderson is the founder and president of StockCharts.com.
He founded the company after working as a Windows developer and corporate consultant at Microsoft from 1987 to 1997.
Since 1999, Chip has guided the growth and development of StockCharts.com into a trusted financial enterprise and highly-valued resource in the industry.
In this blog, Chip shares his tips and tricks on how to maximize the tools and resources available at StockCharts.com, and provides updates about new features or additions to the site.
Learn More