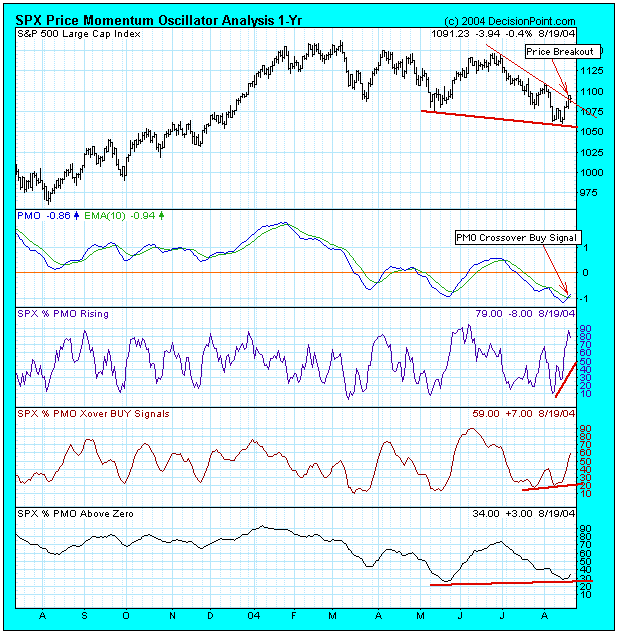
We can't know the full potential of this rally, but there is abundant evidence that we have a solid bottom, and that we are seeing a rally that has at least the potential to move back to the top of the trading range.
First, there are positive divergences on indicators in every time frame. A positive divergence is where price makes a lower low but indicators make a higher low. The dark red lines on the bottom three panels of the chart highlight the positive divergences. These indicators, by the way, summarize the status of the PMO (Price Momentum Oscillator) for each of the stocks in the S&P 500 Index.
Next, we can see prices breaking above a short-term declining tops line, and there is an important PMO buy signal, generated when the PMO crossed above its 10-EMA.
Finally, Percentage PMOs Rising shows a strong initial impulse with a surge to almost 90%.
It is not impossible for the rally to move prices higher than the March top, but, as with the two previous lows this year, the PMO bottom associated with the recent low was too shallow. It would have been better if it had dropped to around -2.0, creating a fairly solid oversold condition.
Overall, this is a pretty good looking chart, but the top of the trading range could easily be the limit of the rally.
