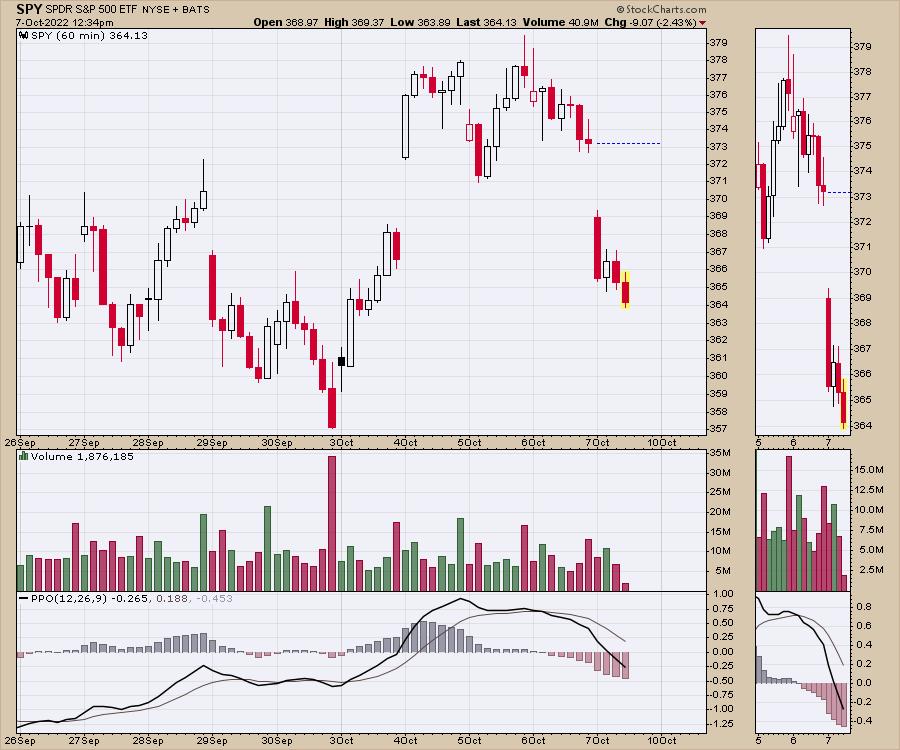
Monday started with a bounce. We were off to the races. After closing on the lows on Friday, we quickly bounced higher. It feels so good when the market rips to the upside. Thursday saw the market work lower and Friday took the wind out of the sails again.

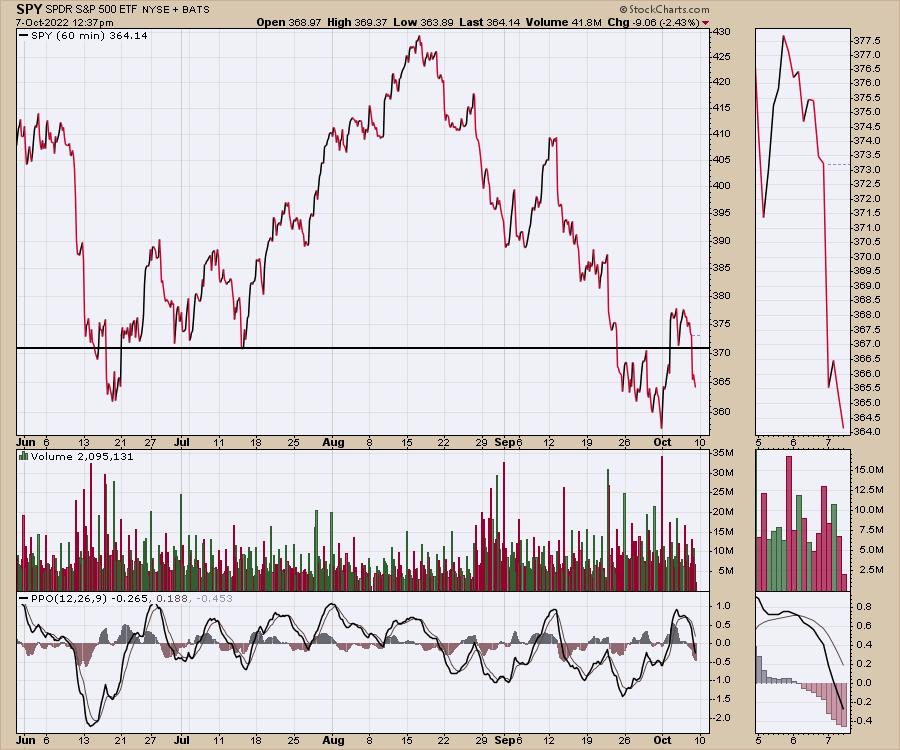
If we make this into a line chart, we have some clear levels that are important. They become more obvious when we open up the chart to include the June low. 371 was a support level in late June that we held above. As we came down and tested the prior low, the market spent a week trying to go lower, and was working hard as it flipped back and forth. This week, we surged back above the 371 level, but could not hold it. Friday is closing near the June low again. Now, it looks more likely that we will need to test a lower level for the market to find buyers.

The fact that it took a week to hold those lows, and the rally couldn't hold for a few days, doesn't bode well for price action next week either.
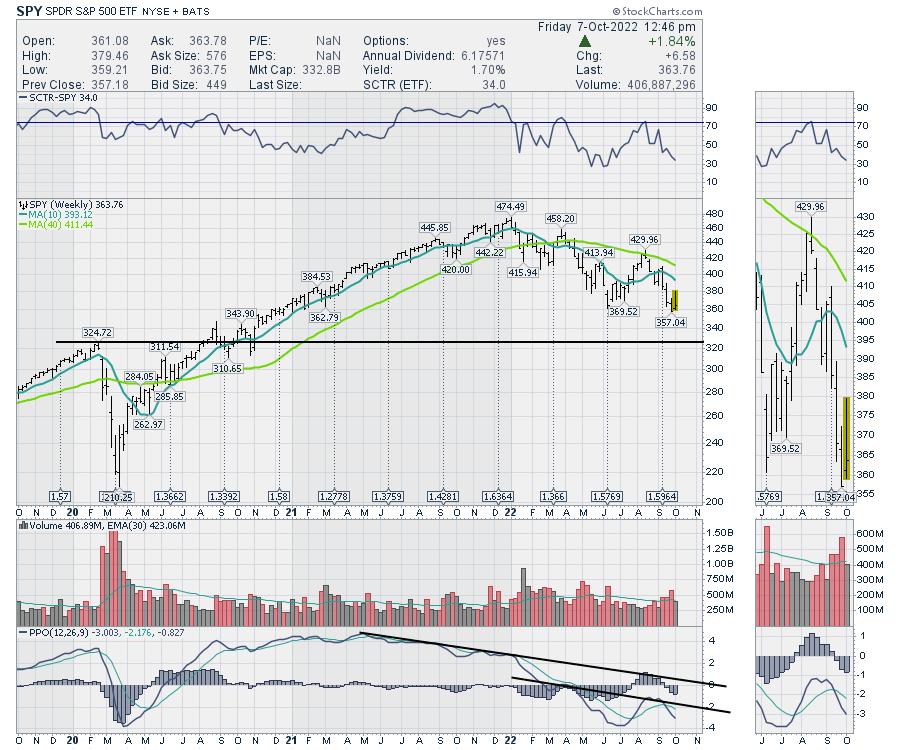
As we expand out to the weekly chart, a few things are becoming more apparent. The black line is where the market topped out before COVID, and now that level looks more likely to be tested.

I have drawn two lines on the PPO. One is a shorter-term trend line from the March highs. The longer trend line goes back to May of 2021. That trend line is still a larger force, that is not being tested at all. The price action this week started to look like we could turn the PPO up here and at least break the short-term down trend in October.
Friday's price action makes the breaking of that short term trend line less likely in the near future. As long as the trend in momentum remains down, it is very difficult to expect the market to go higher. These sudden spurts that roll over quickly weaken the trend in both directions;, but the bottom line is that we are trending down in price and momentum on all time frames.
Lots of seasonality charts talk about October as a good month to expect a bottom. But the volatile price action at these lows makes it very difficult to have and to hold many positions in either directions. There are better times to be invested, and the price action this week confirms that.
Good trading,
Greg Schnell, CMT, MFTA
Senior Technical Analyst, StockCharts.com
Author, Stock Charts For Dummies
Want to stay on top of the market's latest intermarket signals?
– Follow @SchnellInvestor on Twitter
– Connect with Greg on LinkedIn
– Subscribe to The Canadian Technician
– Email at info@gregschnell.com
