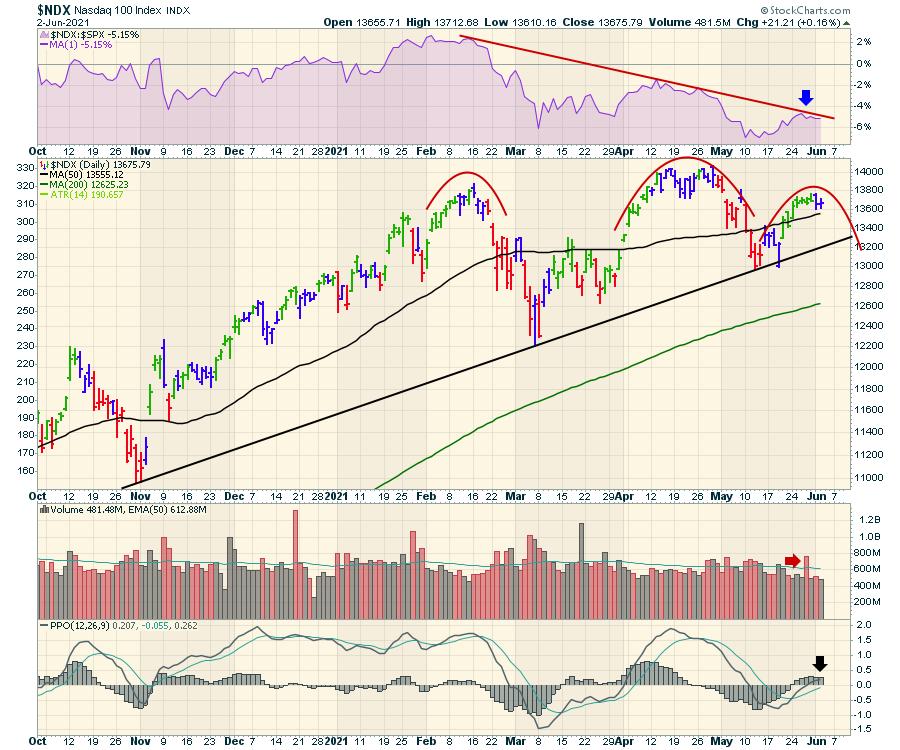
While the commodity trades have been working, it seems that the broader indexes just can't get running higher. The Nasdaq has done nothing for 7 days. The relative strength in the purple shading shows the weakness compared to the $SPX.
But now we have come to a crossroads. We are making a lower high on the right shoulder, which continues to look like a typical topping pattern. The PPO failing to achieve any sort of strength on the bounce is another clue that we are struggling with upside momentum.
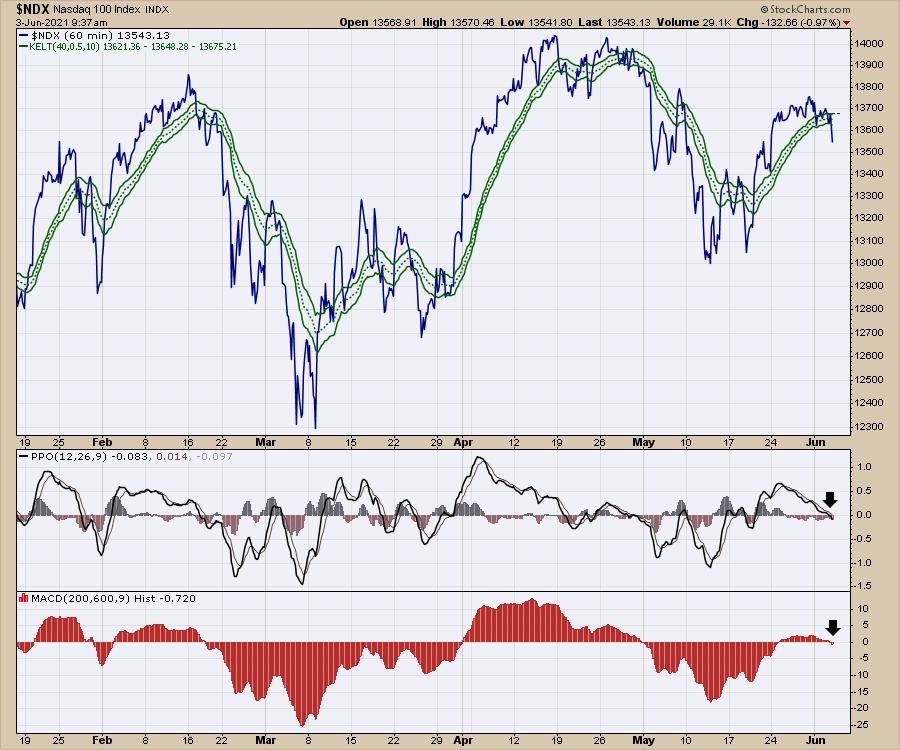
When we look at a 60-minute chart, it also shows the lack of conviction higher.
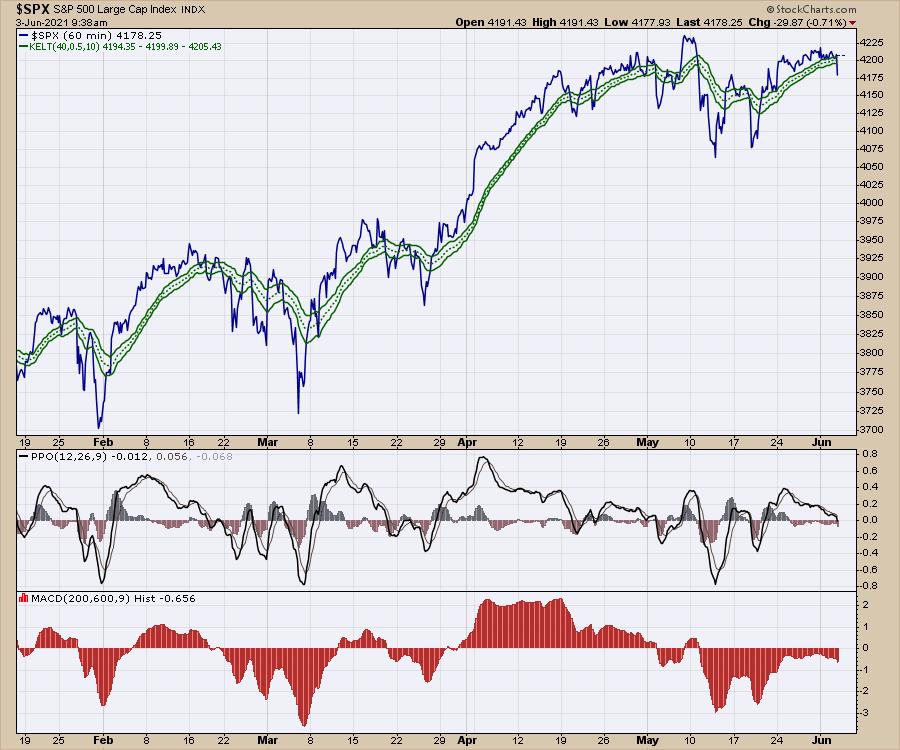
The $SPX is not much better, but it is a little. However, we still have not moved much from the April 16th Options Expiration date or the last Fed meeting on April 28th.
Commodities have been powering higher, and more commodity-related companies trade on the NYSE or the AMEX.
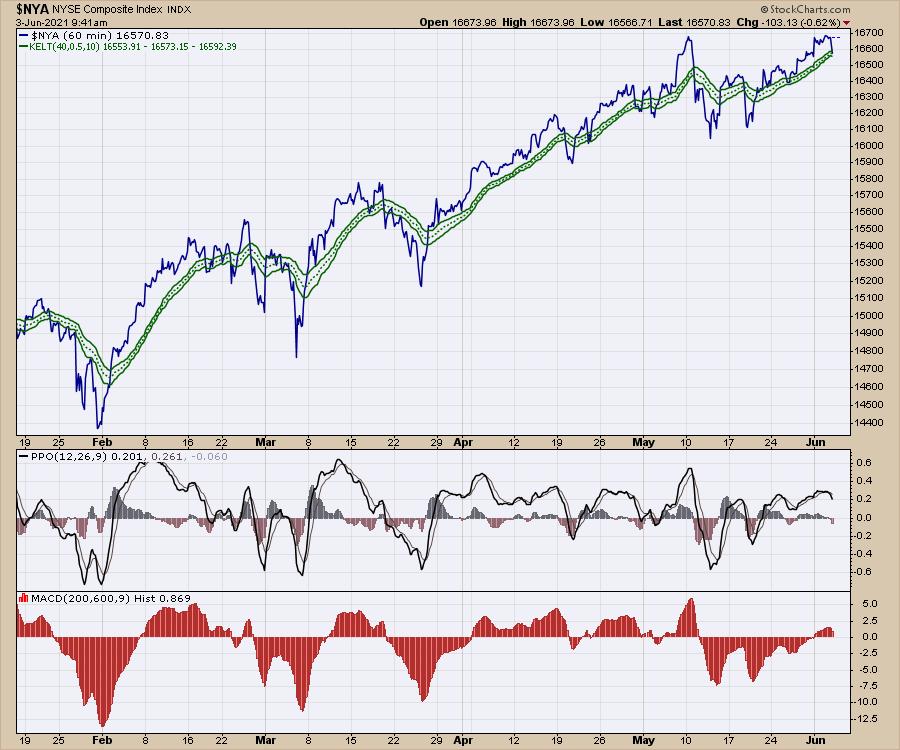
So, the question is: Will the Nasdaq topping structure roll over and pull all of the charts down?
I was chatting with a new home sales person who is also the neighbourhood developer. He gave me a shocking statistic. At the start of the year, they had some starter homes pricing at $350K. With all of the construction material increases, including cement, lumber, drywall, shingles etc. the uptick in costs is $100k, so the starter home has moved from $350K to $450k in 6 months! These are Canadian dollars, and homes here have basements so the cost structure might be a higher number than most people associate with a starter home. The amazing message is that commodities have really surged and may impair a lot of sales in the second half. Not just in housing, but cars and new energy sources, like wind farms and solar farms.
A finance manager for a group of dealerships was mentioning they have a massive showroom with only 8 cars in it. Trucks are so backlogged.
So where does that leave us in the markets?
We all know the price of lumber has soared. Oil just broke to 3 year highs. Gasoline is a pump handle away from 7-year highs. When we look at sector rotation, commodity highs typically line up with the stock market topping. Notice when energy and materials are doing well, that coincides with a stock market top. The chart shows the stock market topping out before the real economic data starts to top out.
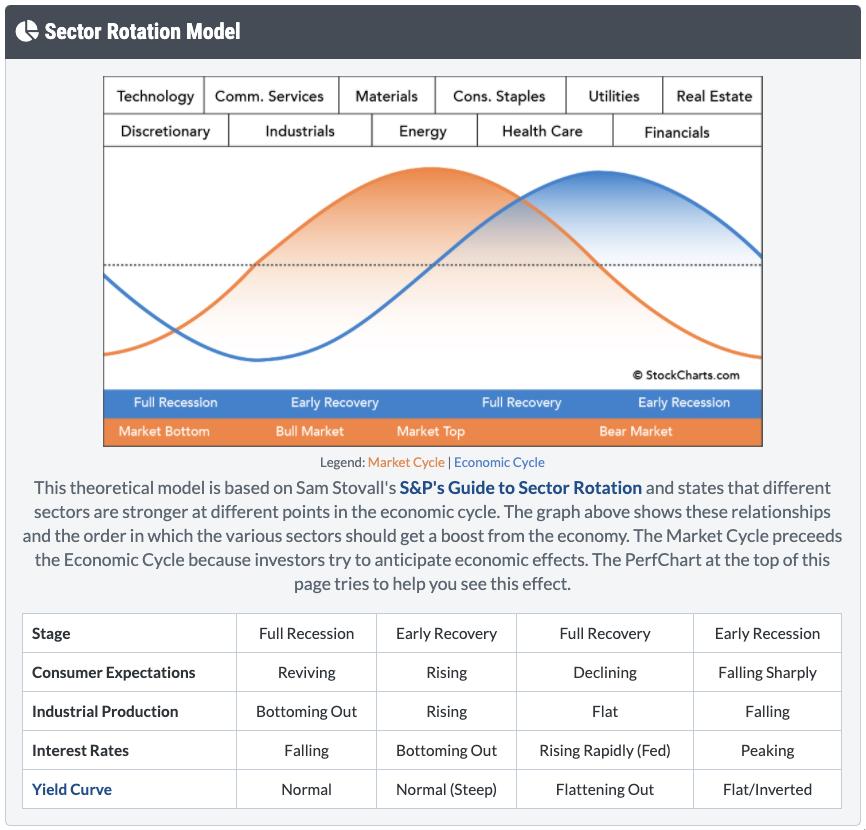
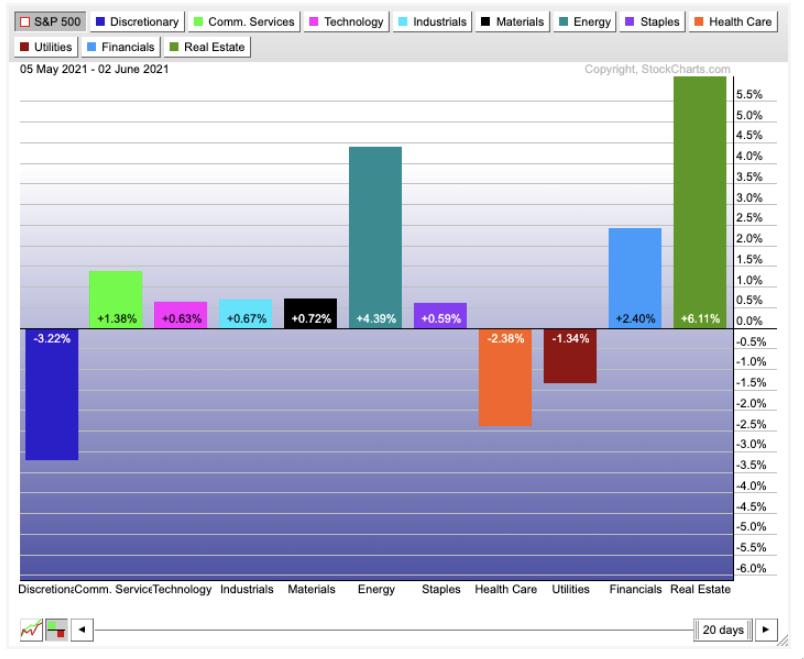
Now this can be on the basis of an intermediate term top that lasts through the summer, or it can be a longer term primary top. The last 20 days have seen the growth sectors rally, and real estate is having a great surge. The weakness in consumer discretionary might be the price inflation coming at us, slowing down the economic momentum.
I recently did a world insights video looking at stock markets around the world. They are all breaking to new highs.
World Market Insights
It would seem that, once COVID vaccinations are able to curtail the virus, we will be able to get back to normal densities of people working inside factories and sawmills, providing more materials to the market, which will help pause this massive inflationary pressure. Without question, starter home prices can't really climb $100k every 6-months and expect home buyers to be able to afford that with rising rates. It's time to watch closely to see if it is just a summer pullback coming our way.
Good trading,
Greg Schnell, CMT, MFTA
Senior Technical Analyst, StockCharts.com
Author, Stock Charts For Dummies
Want to stay on top of the market's latest intermarket signals?
– Follow @SchnellInvestor on Twitter
– Connect with Greg on LinkedIn
– Subscribe to The Canadian Technician
– Email at info@gregschnell.com
