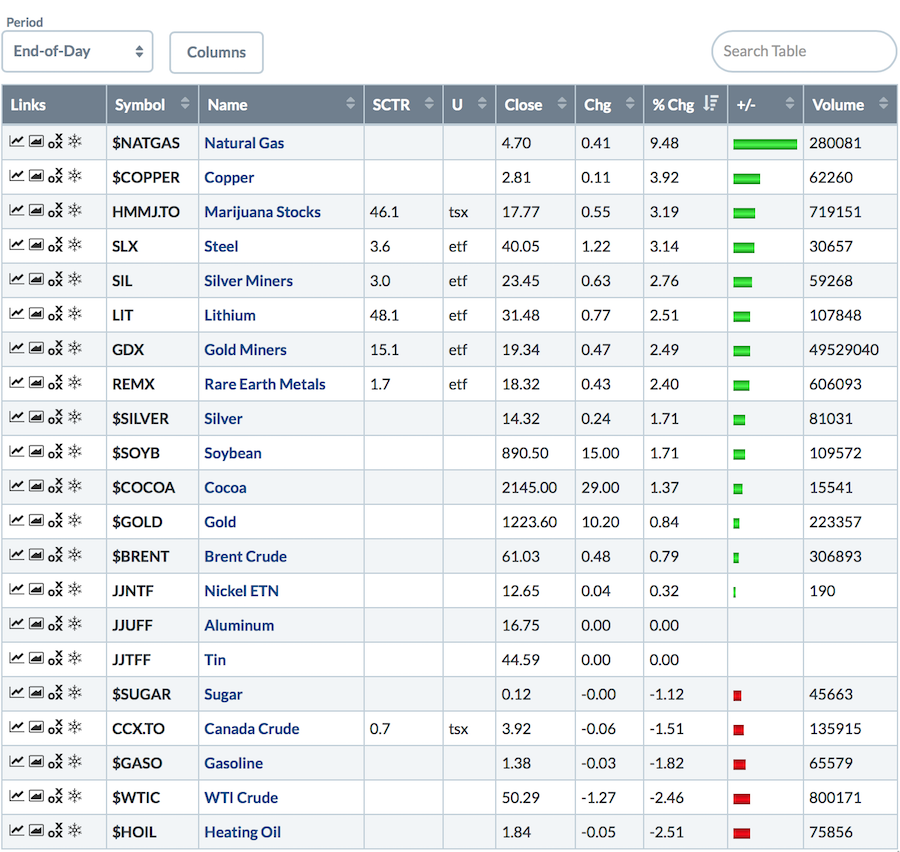
Commodities had a big rally on Wednesday, with the exception of crude oil, gasoline and heating oil. Once Jay Powell started talking and the US Dollar started dropping , most commodities roared. Natural gas has been swinging wildly of late with big back and forth directional moves so aggressive traders are liking that area. For trend traders, the industrial metals continued to pursue higher ground. I have been covering this in the videos in recent weeks. Titles like Metals and Mining Stocks Surge have been controversial as most people are expecting lower levels.
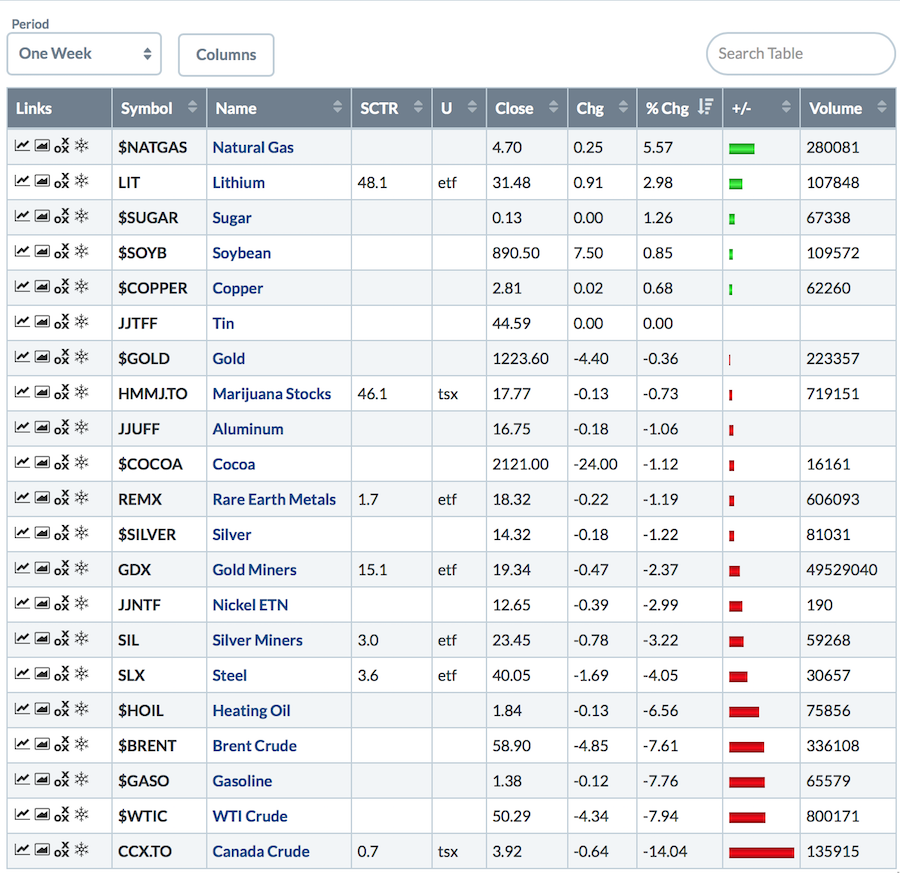
 However, over the last week it has been tough sledding. Steel and Coal ETF's broke below support last week. Silver sits a whisker above 4 year lows with a really solid level that has been tested over and over ...gulp. The decimation in the price of oil was traumatic last week. It sent a batch of the related stocks into tail spins that were enhanced by tax loss selling. Needless to say, the oscillations in the Metals and Mining stocks have been big as well with the data shown below for one week.
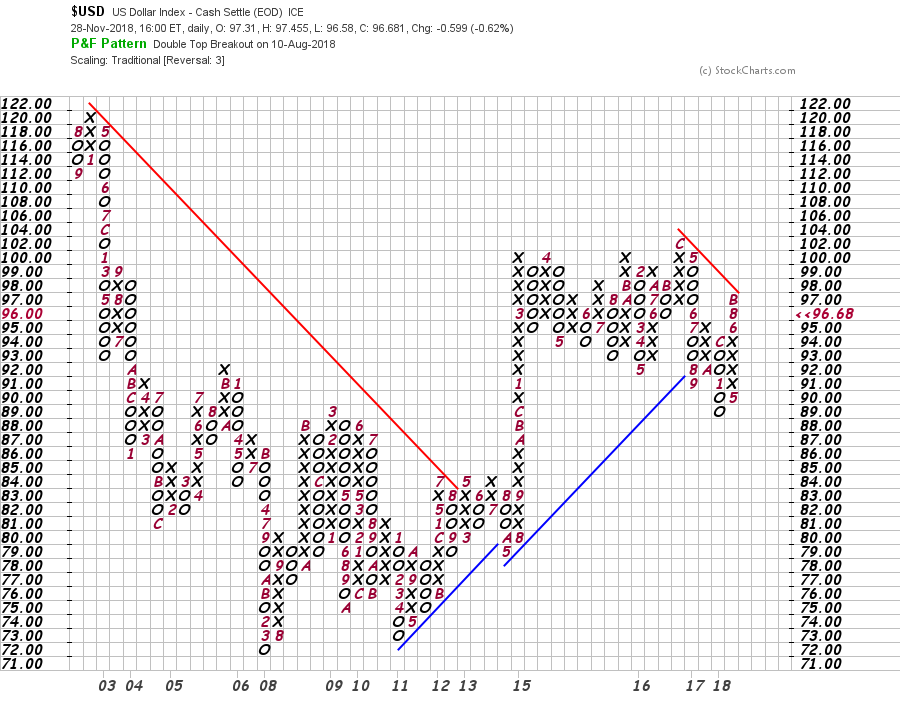
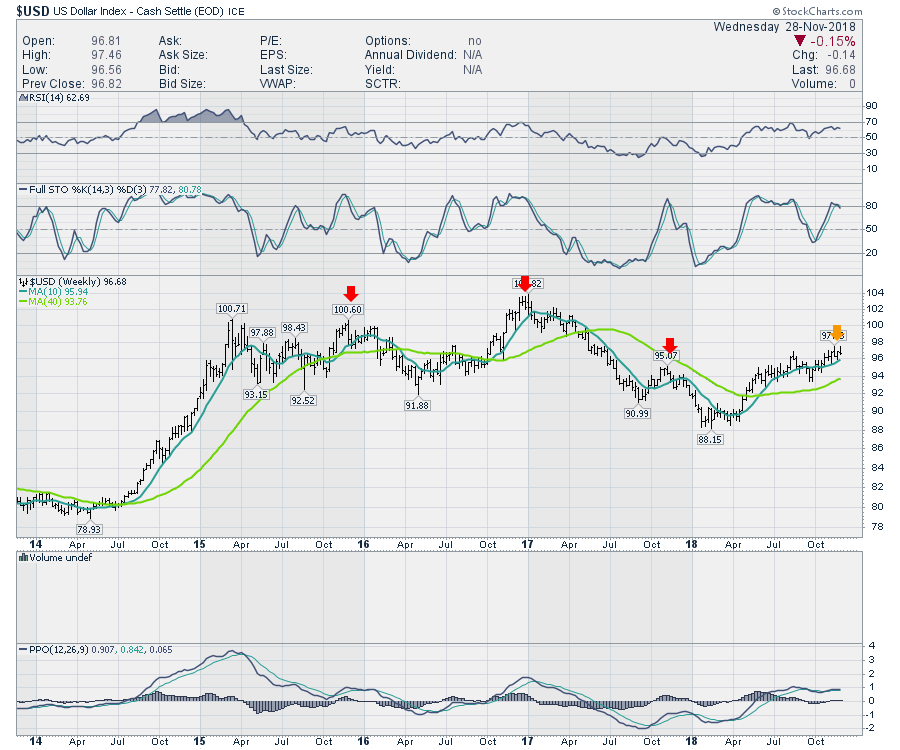
 What does a person do? We are at a major level of importance on the $USD. The PnF chart lays it out beautifully so I'll start there. Because there is a down-sloping line on the PnF chart in red, this is suggesting the $USD is in a bear market mode. If the chart was to remain in a bear market, this is where we could expect it to stop. If it is going to stop here, then the rotation into commodities and emerging markets would be a good idea. If it doesn't stop here, it would probably create a massive ripple throughout the world. Even in September, as the US Dollar surged higher the equity market rolled over. The PnF chart makes the bear market case a little more obvious with the series of lower lows. The highs of December 2016 look recent on a PnF chart, but not as recent on a chart with an evenly scaled time axis on the lower border like a candlestick chart. The push above the column of X's from 2017 shows that top was also made in the 4th quarter between October and January. For the last three years, (2015,2016,2017) the tops have been in the fourth quarter and now the chart is up against the bear market trend line late in the fourth quarter 2018. Coincidence?
 Using a bar chart makes it a little clearer. There is no specific direction right now in terms of momentum. However, both the moving averages are still pointed up, which suggests to stay bullish on this weekly chart.
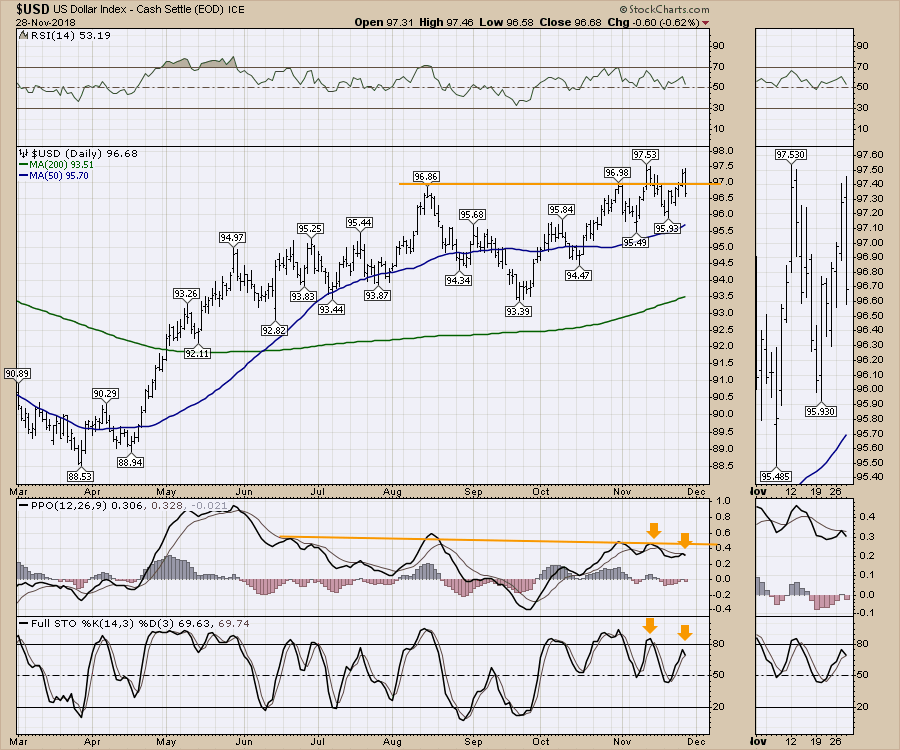
 Drilling into the daily, some further evidence of weakness is starting to show. Notice the three drives towards a breakout on the dollar all in November. None have been able to sustain the breakout above the August highs and with the lower Full Stochastic reading and a second lower high on the PPO, this looks set to accelerate lower. That's a very hard call so close to the highs. That's what makes this a nice setup to watch.. If the breakout can't hold, metals and miners should roar right on queue. If the US Dollar roars higher instead, we have a great location for a very tight stop on our trades.
Here is this week's broad market review video.
A funny story from this weekend. My daughter was at the library signing out books. She looked to see if the City Of Calgary library had ordered any of my books. Well, the good news was they had five in inventory, but they were all signed out and a waiting list! That's fun for me to hear!
If you are looking for a small gift, you might have family or friends that would like to learn more about the basics of charting. The first section of the book walks through all the chart settings to get the charts you want. The second section is why you might use charts for investing and the third section is putting it all together.
Click here to buy your copy today! Stock Charts For Dummies.
The Canadian Technician video shows the bounce off the late October lows in Canada. Canada is back below the 2008 highs. Tough ten years for investors.
If you are missing intermarket signals in the market, follow me on Twitter and check out my Vimeo Channel often. Bookmark it for easy access!
Good trading,
Greg Schnell, CMT, MFTA
Senior Technical Analyst, StockCharts.com
Author, Stock Charts for Dummies
Hey, have you followed me on Twitter? Click the bird in the box below!
Want to read more from Greg? Be sure to follow his StockCharts blog:
The Canadian Technician

