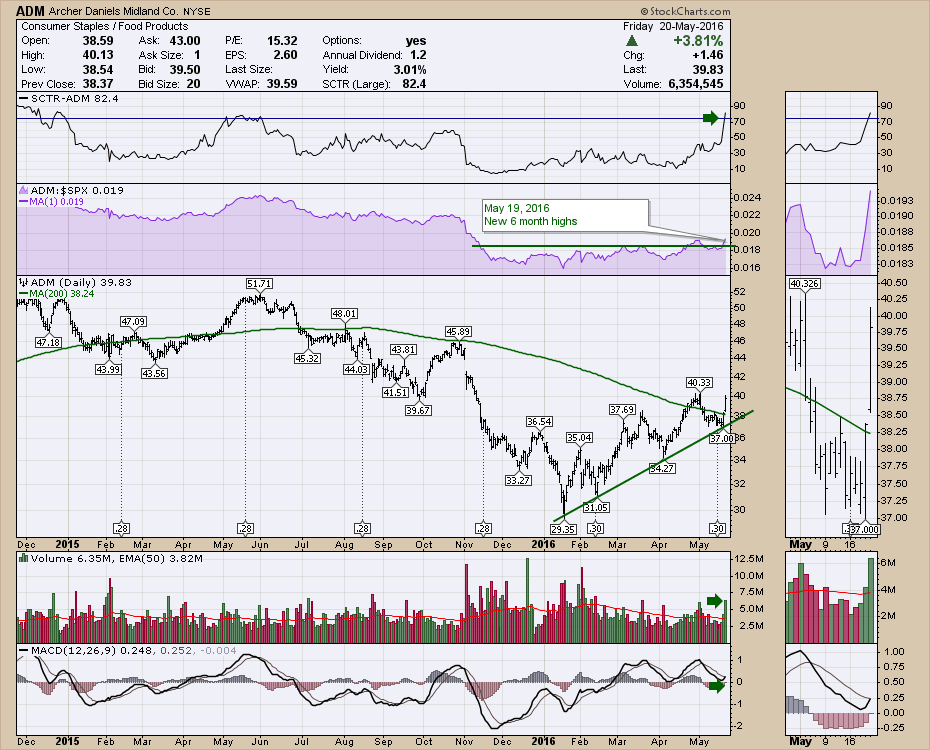
Archer Daniels Midland (ADM) is a big player in the Agriculture Industry. ADM revenues are 64 Billion. So the 64 Billion dollar question is : Can this stock start to outperform? Let's look into the chart.
The stock has been trending down for a year. This week, the SCTR finally went back above 75 for the first time in a year. The Relative Strength shown in purple is at new 6-month highs which is bullish. The price has recently moved above the 200 DMA for the first time since last summer. After a small pullback, today showed a renewed interest as the ADM stock surged higher. The volume was 80% higher than normal which is very nice with the surge in price.
 Lastly, the MACD is also turning higher from above zero which is very bullish. This chart is setting up nicely. With $37 as support, this looks like a nice uptrend to participate in. There are some other factors that make this chart interesting.
We covered off some agricultural related trades on the Commodities Countdown Webinar 2016-05-19. This ADM chart fits with the big picture that was discussed on the webinar. A blog highlighting some commodity discussions is rolling through the internet. That article can be found here. Commodities Countdown Blog. Feel free to click on the YES button on each blog if you would like to get them delivered to your email. As a writer of the Canadian Technician blog, I outlined a significant inflection point for the currencies that affects some commodities more than others. Here is a link to the quick review. Currencies. As well, there is a YES button at the bottom of that blog as well that you may find interesting. I usually write an article 1-2 times a week, so you'll get an article that keeps you aware of some new investing ideas.
Have a great weekend and remember that Archer Daniels Midland (ADM) probably had a hand in some of the commodities that made it to your home!
Good trading,
Greg Schnell, CMT, MFTA.
