On Tuesday, during the Canadian Technician Webinar 20160308, I reviewed the various Canadian Sectors.
I demonstrated the various markets using the RSI indicator on weekly charts. This generated some great questions. While the RSI is used by some on a shorter time frame, I like using the RSI on the weekly time frame.
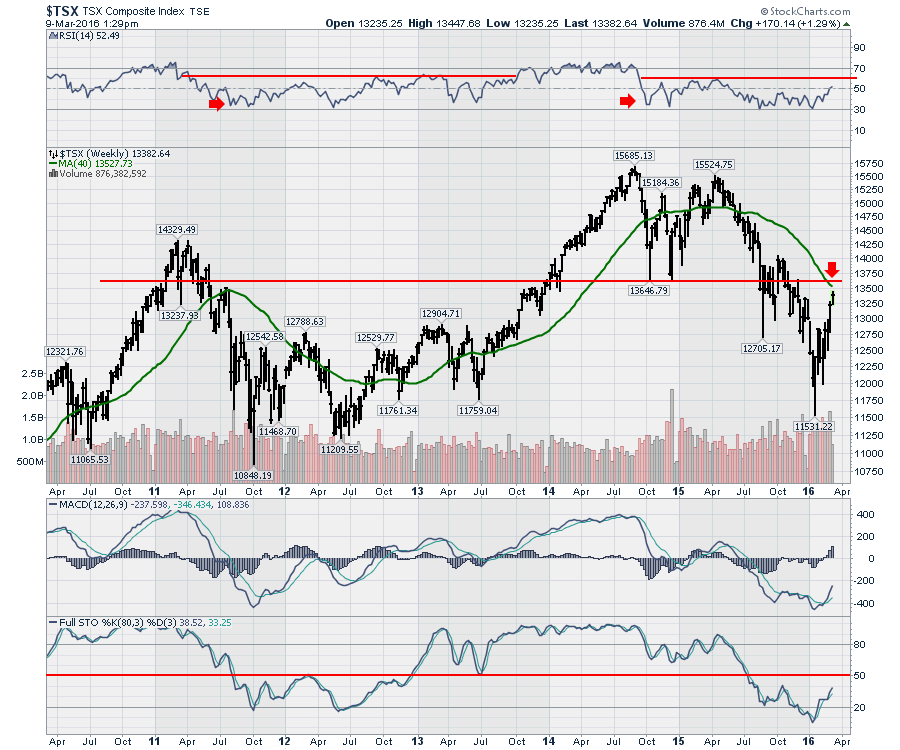
For the $TSX, here is the chart. Notice the RSI is trapped under 60. The red arrows indicate a weak RSI below 40, which indicates a bear market signal. We are currently testing horizontal support/resistance marked by the red line as well as the 40 WMA. A down-trending 40 WMA is bearish and a test at that level is important in my work. The weekly MACD has not made a higher low yet and the long cycle Full Stochastics are below 50. For those following the webinars, we were getting long at the January lows. Now this appears to me to be near the end of the move higher.
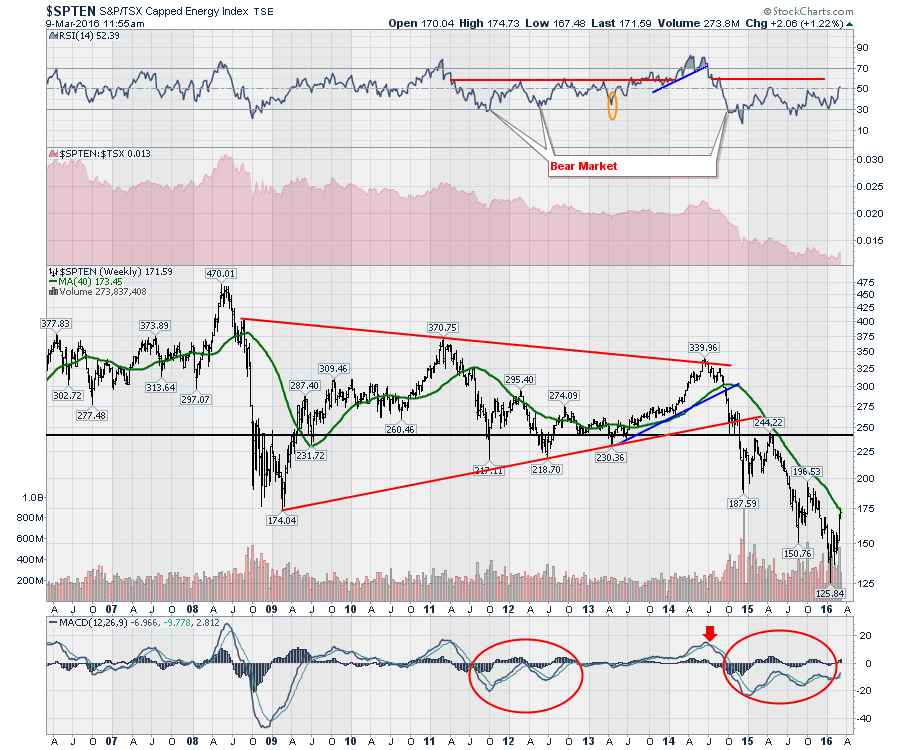
For energy, we are still in a bear market as the RSI continues to stay below 60 from our last signal. We are currently testing the 40 WMA shown as a green line on the price chart and bear markets typically have trouble at this level. An example is 2011-2013.
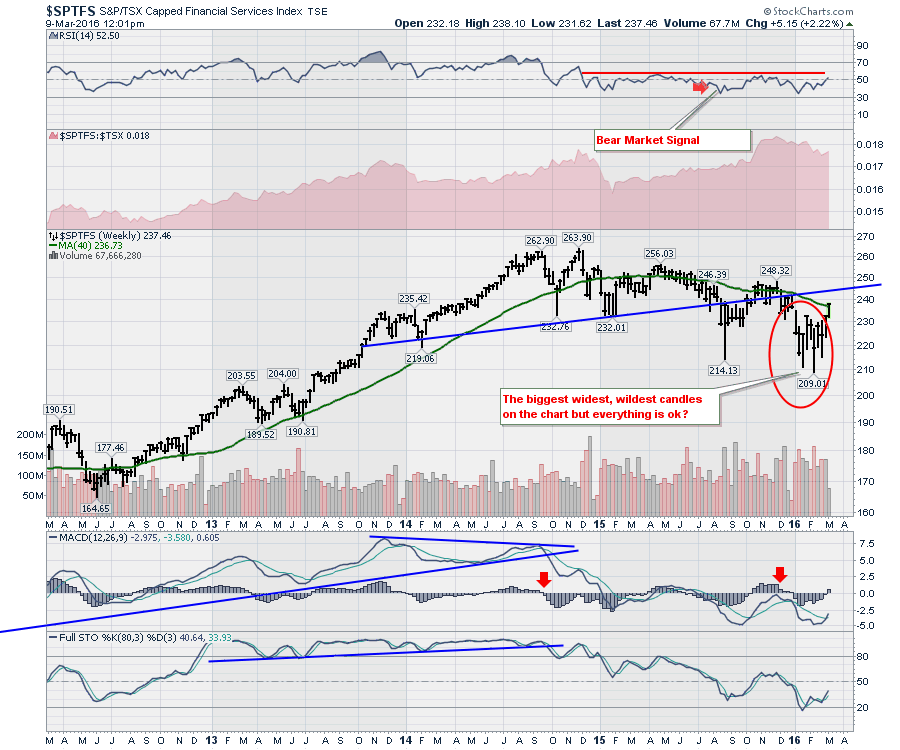
Next is the Canadian Financial Sector. We are currently testing the 40 WMA from the bottom. It has been pretty major resistance since the start of 2015. Lower highs and lower lows are intact. The shaded area in red shows the financial sector, in general, outperforming the $TSX. No real surprise with the mining and oil sectors wiped out. The real question will be how well the banks deal with the debt of the oil, oil service and mining companies going into bankruptcy. Currently, the bear market looks to have a firm grip. A higher high at 250 is still possible, but currently, I think this bear market rally is extended and might have another week to run. I expect a roll over here.
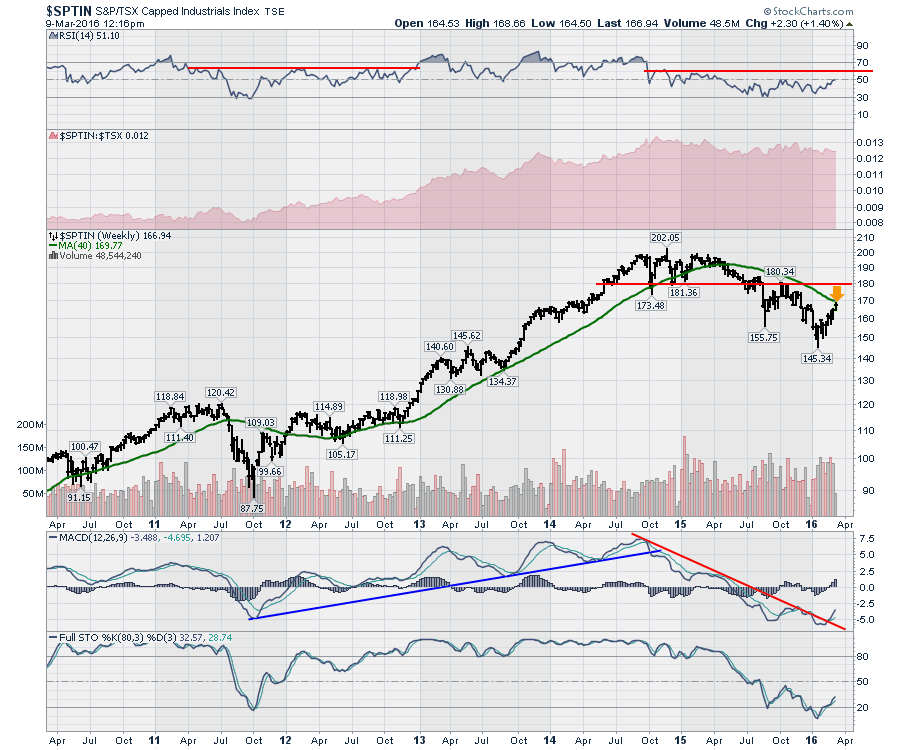
 The Industrials have been praised in the media as a new bull market and Canada's exports are surging on the back of the Canadian Dollar weakness. While the story is a good one on the rebound, technically the chart is still in a bear market and we are just approaching resistance annotated by the orange arrow.
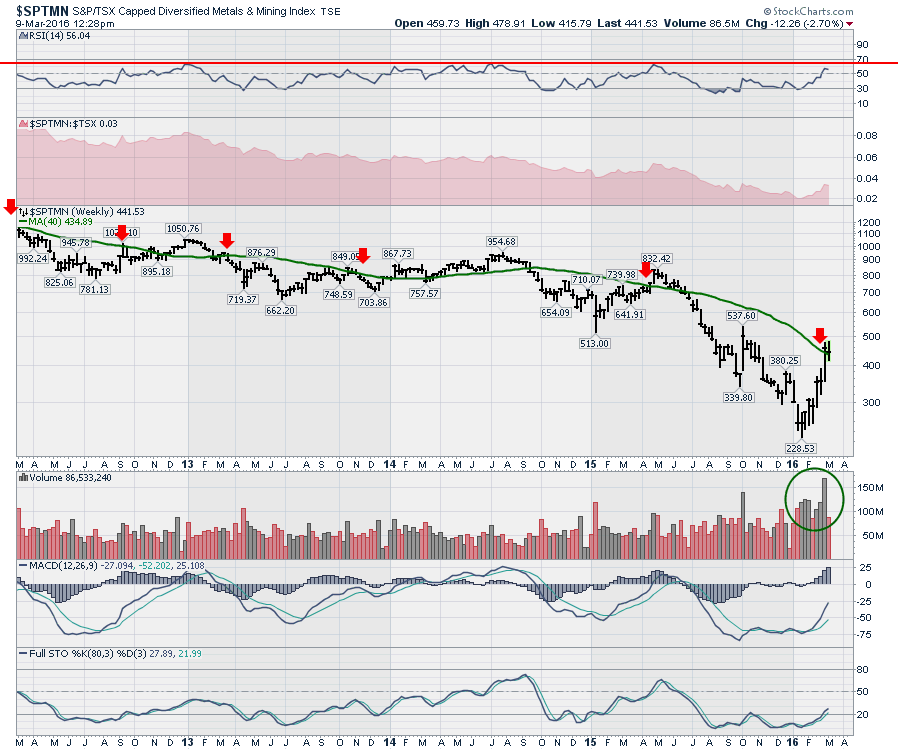
 The miners have been on a run. Unfortunately this week, the price action has been as quick and severe as stomach flu. While the 40 WMA has been breached a few times, it didn't make it far before reversing. The current test of the 40 WMA, with the other sectors like financials being weak, doesn't instill confidence. The size of the move last week was huge. From 350 to 475, which is 125 points. From the 350 low, that is a move greater than 33%! The recent volume accumulation is important. On the next pullback, perhaps we'll get a signal to get long the miners. Based on the RSI, the current trend is intact. I would like to see the RSI test the 40 level. If that were to hold, this would look a lot more bullish!
 There were some sectors leading the Canadian market. You can find out more on the video if you are interested in the rest of the sector analysis. The Canadian Technician Webinar 20160308. The bottom line is until the indicators start to show improvement, the bear market looks intact in all the major Canadian market sectors.
I will be doing a Commodities-focused webinar on Thursday, March 10, 2016. Click here to register. The Commodities Countdown 20160310.
Regarding connecting to my articles,
I was recently asked about subscribing to StockCharts blogs. You must subscribe to each blog independently. I currently write on four different blogs within StockCharts. The Canadian Technician, The Commodities Countdown, Don't Ignore This Chart, and the ChartWatchers newsletter. If you are missing some of the commentaries I refer to, it could be posted on different blogs. I try not to duplicate across them. Sometimes different gold articles are discussed on the Canadian blog as well as the Commodities Countdown blog as an example. Please register for each of them independently. We are trying to allow you to control which writers hit your inbox. You can also follow me on twitter @schnellinvestor. You can also connect with me on LinkedIn.
With that, I'll end this note. Thanks for taking the time to follow along!
Good trading,
Greg Schnell, CMT, MFTA

