Canadians have been looking in disarray at the comparison between the Canadian Stock Market and the US Stock Market. On the US side of the border, the market has been going continuously higher for a couple of years, but has now been consolidating. On the Canadian side, the market has wiped out bulls and bears. If a Canadian investor follows (rotates to) the strong areas of the market, the Canadian investor would be ok. However, many investors invest in what they know. Car Industry investors have invested in Magna, whereas Western Canadian investors have been trying to buy a bottom in Oil & Gas stocks for years. While the price of Crude Oil only recently collapsed, Natural Gas investors have continued to be tempted by sudden price rises, only to have the price roll back over and accumulate more losses in the related stocks. When the Natural Gas price finally does break out, no one will believe it. US investors have been able to see the big outperformance with Biotechs and are probably tuned in to it as the US investors have a lot of large companies with liquidity and can move around more.
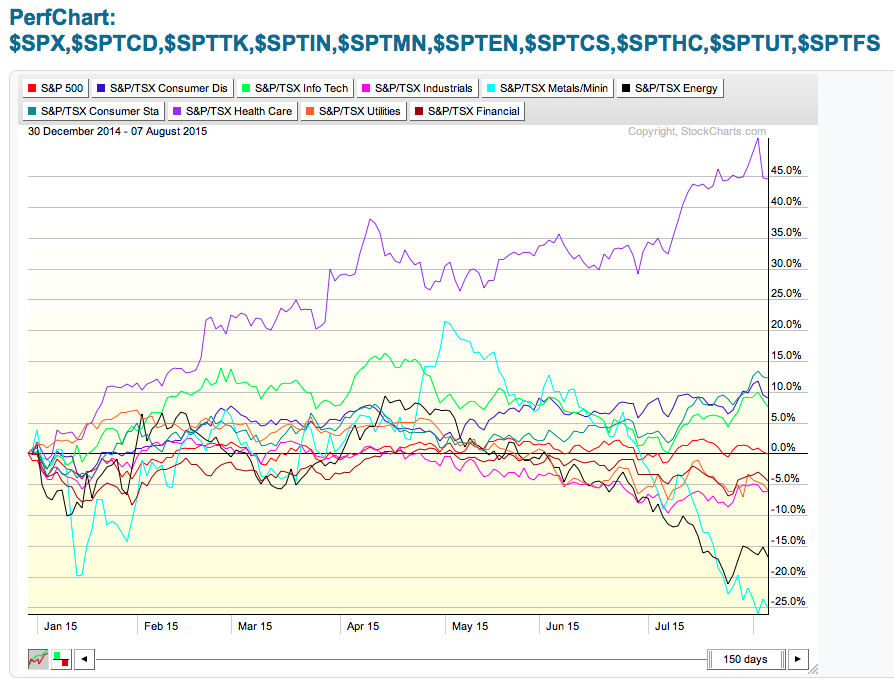
Canada's stock market leadership has moved around the country with the poisonous rebound of Blackberry in Waterloo, the 80% plunges in oil patch companies in Calgary to the current groundswell towards Laval Quebec with Valeant Pharmaceuticals (VRX.TO). However, for investors in the $TSX index after a few roller coasters, the buyers of the XIU.TO would only be down 2.3 % YTD.

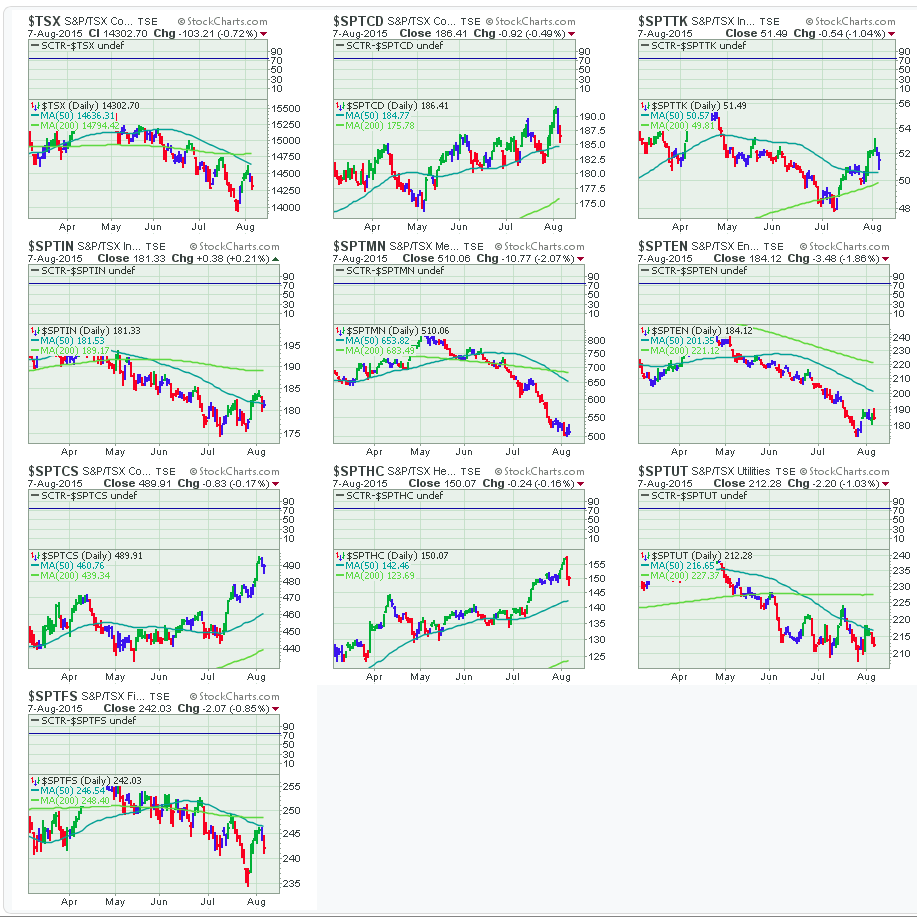
Most of Canada's banks are below the 200 DMA and all of the major banks put in their highs last year. Now one of the banks is making new 52 week lows. Others are threatening but only one has. So where do we go from here? Let's look at the internals of the Canadian Market. Of the nine areas inside the market, Consumer Discretionary (Cyclicals ($SPTCD)), Consumer Staples ($SPTCS), and Healthcare ($SPTHC) are making new highs. The Consumer Cyclicals are not considered a defensive area, but some components in there are doing well. With the rate of change in Healthcare Biotech discoveries, the Biotech arena is carrying Healthcare to a very bullish long term investment. This is not new, but it does mean that the areas inside the Healthcare space that were formerly considered defensive can be overshadowed by the biotech area. In this case though, the defensive areas of Healthcare are doing well.

With the three big dogs in Canada being Materials ($SPTMN), Energy ($SPTEN), and Financials ($SPTFS), this makes it difficult for the Canadian market to advance. The Utilities ($SPTUT) and the Industrials ($SPTIN) are also below their 200 DMA's so that is bearish. The Technology sector ($SPTTK) has rolled over from highs back in April and is now sitting on top of the 200 DMA. For the last 3 weeks, Technology has been trending up so that would be an improvement.
While Canada has not followed America's lead, it is also important for us to be aware of what is going on there as well. The US market has been moving sideways since QE ended last October. There was a brief breakout to new highs on the back of the Europeans introducing QE, but the overall market has fewer stocks participating in each rally. As an example both the Nasdaq and the NYSE exchange have less than 50% of the stocks above the 200 DMA. The Nasdaq has 43% above the 200 DMA, while the NYSE only has 39%. For perspective Canada's $TSX only has 29% of the stocks above the 200 DMA. So that is not stellar.
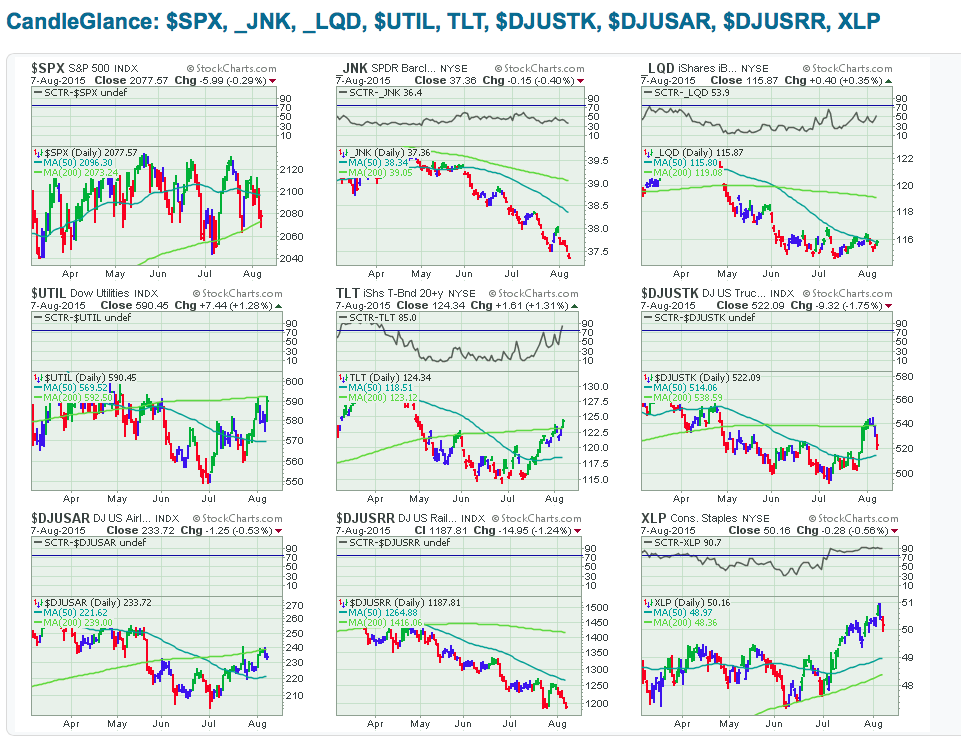
Recently both Junk Bonds and Corporate bonds in the US don't look as good as they have, with the Junk bond chart (JNK) making new 3 year lows if you back out the interest dividends paid. Corporate is the LQD chart below. The green candle on Friday made the week look a little better, but the break of the July uptrend was not encouraging. Staying with bonds, the long bonds got another bid on Friday pushing the TLT to its highest level in 3 months. The Utilities moved to near 3 month highs on Friday. which can be a defensive posture. The Consumer Staples look strong while all of the transports look a little weak. I will say the Airlines are moving higher recently as Oil makes new lows. However, they are not near the highs they were at the first time oil dropped. Trucking surged and then rolled right back over, so the truckers are keeping the bull/bear debate alive and well in their sector.

It is interesting that the US employment data was robust this month but the Challenger job data showed a lot of companies starting to lay off. This link to the Challenger job data is showing a surge in job cuts within July and more than double either May or June. They announced a surge to 4 year highs. So while the US Indexes are still near their all time highs, there continues to be more economic data showing headwinds. That points to a rather gloomy outlook south of the border, but the indexes continue to hold near the highs. With the thinning participation of stocks as shown above, investors should be mindful of how quick the tables can turn if the leaders start to give way.
To conclude, I don't think it matters which side of the border you look, the charts are similar. Sometimes the weak countries will start to break down and if enough weakness shows up, the US markets eventually follow along in some fashion. The charts above have a defensive alignment on both sides of the border. While no one makes a lot of money being bearish, you can save a lot of money by being defensive when the markets appear to be weakening. Having Canada very weak and the US markets getting weaker is illustrating the concept. Caution is advised if you are long equities. If you are long, you may want to consider rotation to defensive areas of the market if you are not already there. For high risk investing, Oil and Gold both look so stretched to the downside but we saw some buying recently in both producer groups. There may be a rally forming there, but I wouldn't want to overstay the welcome.
I publish charts on multiple blogs within StockCharts.com so I encourage you to consider subscribing to each of them by email. A lot of the commentary is evolving through time and the story is continued in each blog by talking about different aspects of the market. Be sure to look across the blogs to get a wider view. I enjoy working with Martin Pring and he joins me this week for the Market Roundup Live Webinar on Thursdays at 4:30 EDT. Links can be found on the home page. Finally, if you like what we do, feel free to share links with your friends. We are always looking to introduce investors to Technical Analysis and this collection of authors provides a broad spectrum of analysis styles. We hope you enjoy the variety. If you have friends that have not become subscribers, you can get additional time on your membership if you introduce new members to a StockCharts subscription.
Good trading,
Greg Schnell, CMT
