There are 7 previous articles in the Solar series. Search through the December 2014 Canadian Technician site using the word Solar in the search box or visually scan the titles.
Today, we want to implement some basic scanning techniques. These are very, very easy. You can use them for whatever you want so feel free to save them in your own scans.
Let's start with a simple scan. A Positive MACD Crossover.
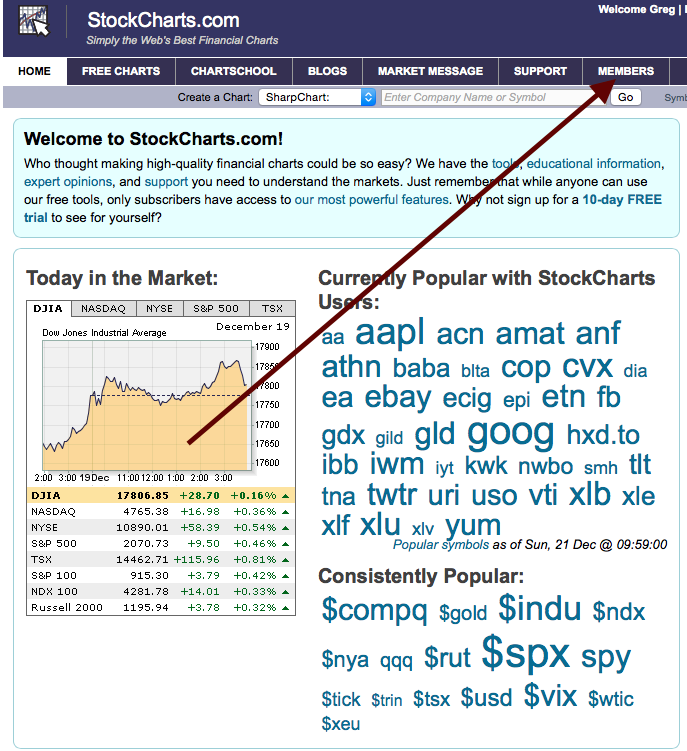
Start on the Members tab.
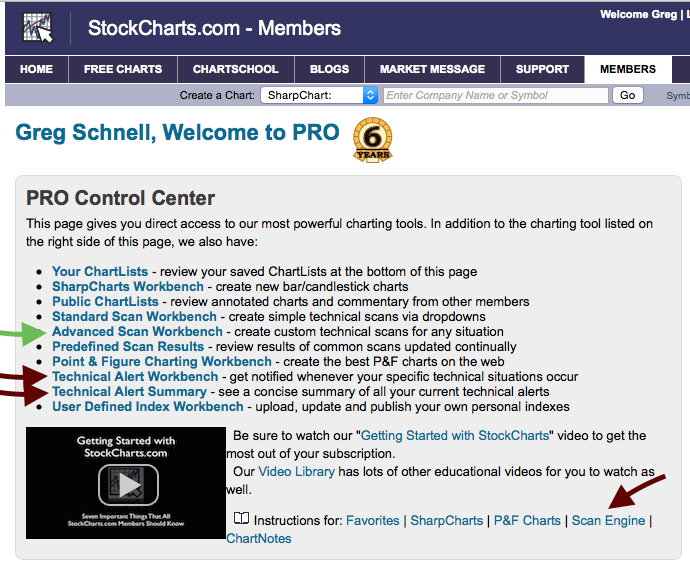
That brings you to the powerful page of StockCharts. Your private working area. On this page are all your scans, technical alerts and chartlists.
Notice the instructions section for the Scan Engine. Lots of great information there. We are going to jump into the Advanced Scan Workbench as noted by the green arrow. Follow along by clicking on the 'Advanced Scan Workbench' on your members tab.
That is going to bring you to a page like this.
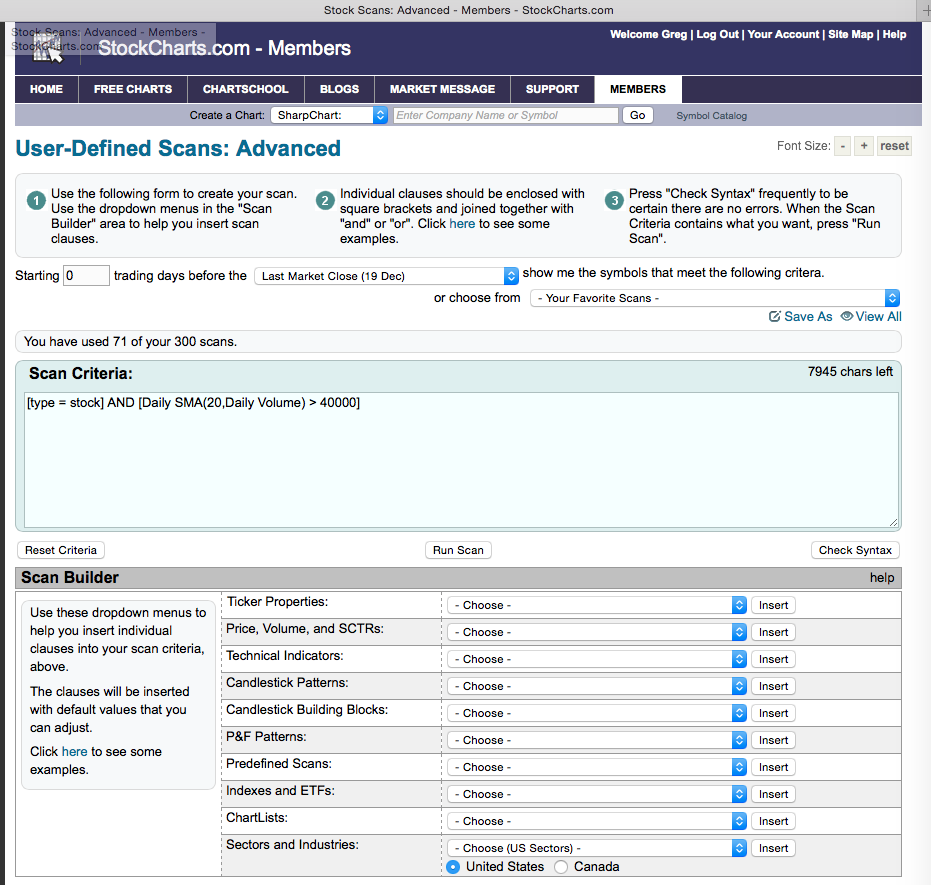
This page is so simple. Really easy to use. When we scan, we want to scan efficiently. So we don't want to scan for an Ichimoku cloud setting on every chart in the universe and then the last thing is limit to our solar chartlist. We want to start with the solar chartlist. Then it is only going to look at the ticker symbols we have in that chartlist. After we have defined how narrow our scan is, we want to scan on specific indicators or conditions. That makes the scan run super fast.
So for this assignment, we only want to scan things in our Solar Scanning Chartlist 2015. First things first. The box with the green and purple arrow is where we write scan code. Sounds formal. It's not. Two key pieces. The first clause in the scan does not have the word 'and' in front of it as shown by the green arrow in the box. The second key piece is that every other clause has the word 'and' as shown by the purple arrow.
So we want to add our ChartList. Down at the bottom is a dropdown for a ChartList. Select your ChartList. Your list number will be different depending on how many ChartLists you have. Select the Solar Scanning ChartList 2015 and hit enter beside the ChartList dropdown. Important: It will add it to the bottom of the scan box so if you have a long scan, you will have to scroll down to see it. These will be short scans.
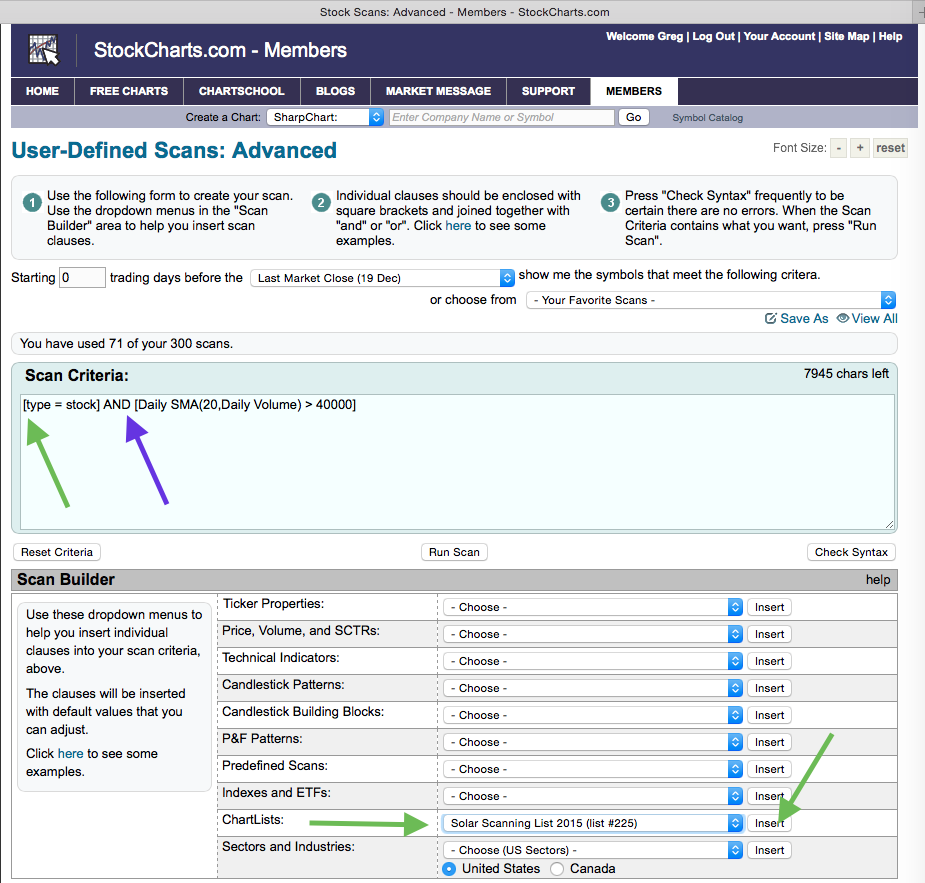
The result should look like this.
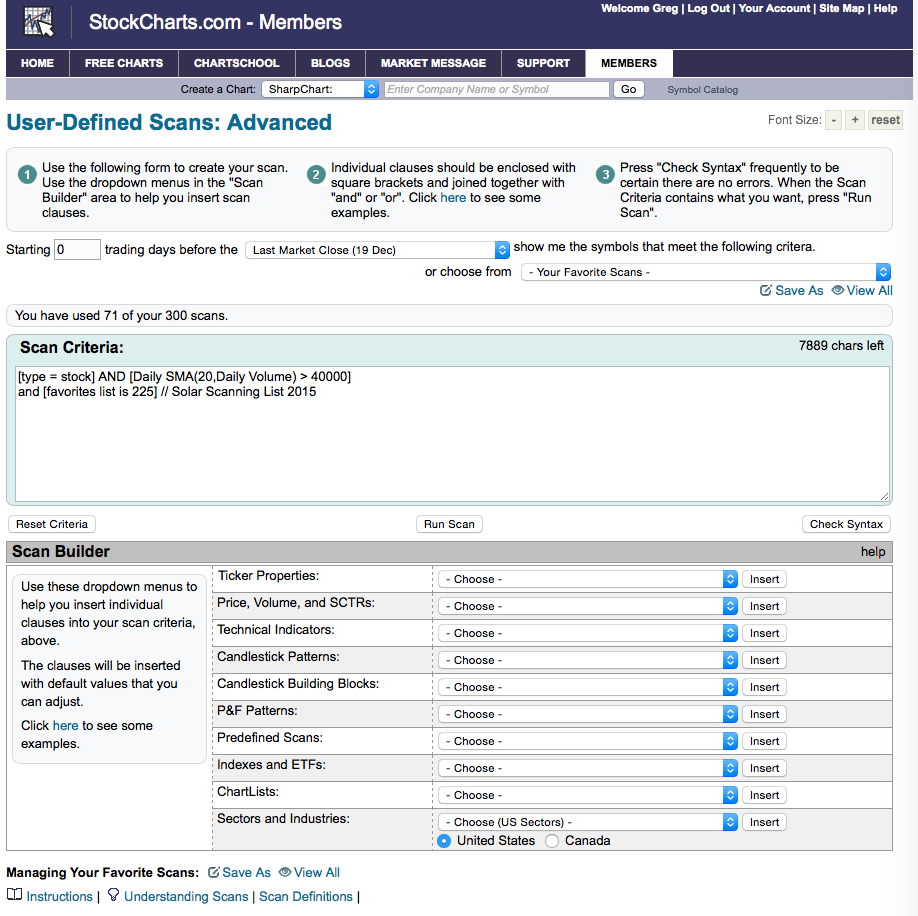
However, now we don't need to limit the US stocks and volume. So we will delete that. However, the word 'and' is automatically placed with all the new scan elements so you don't forget to add it each time. In this case we will remove the 'and' as well so that the first clause of the scan does not start with 'and'.
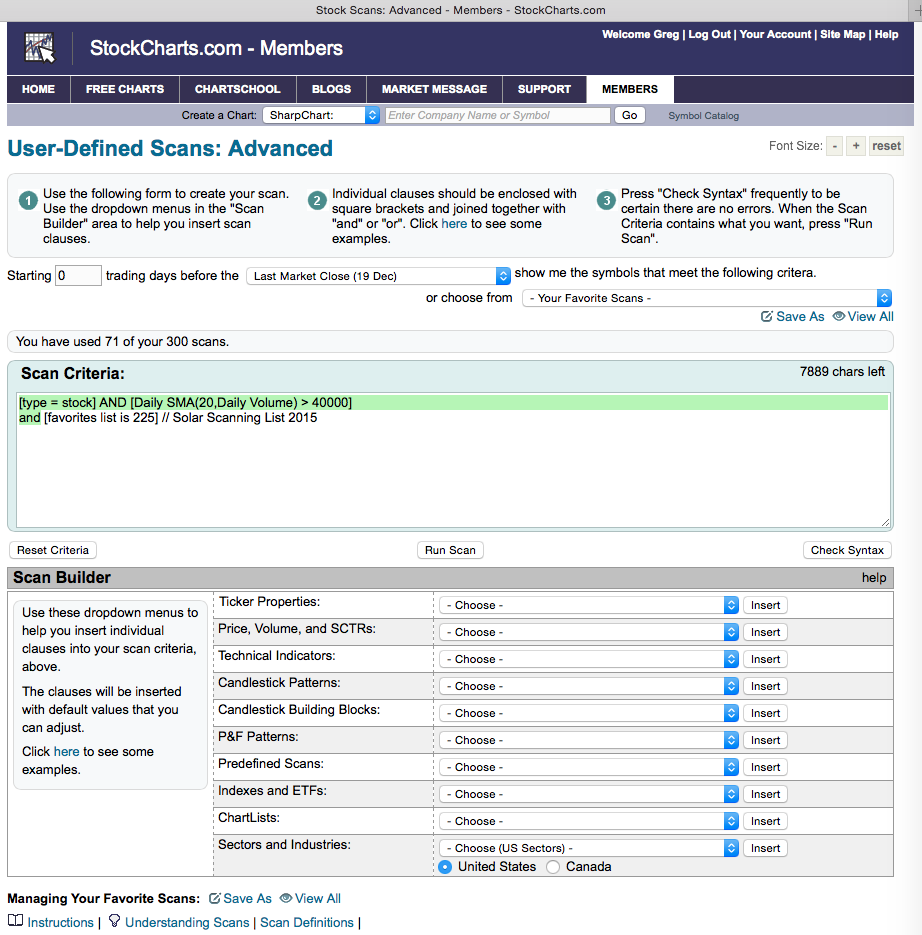
The result is this.
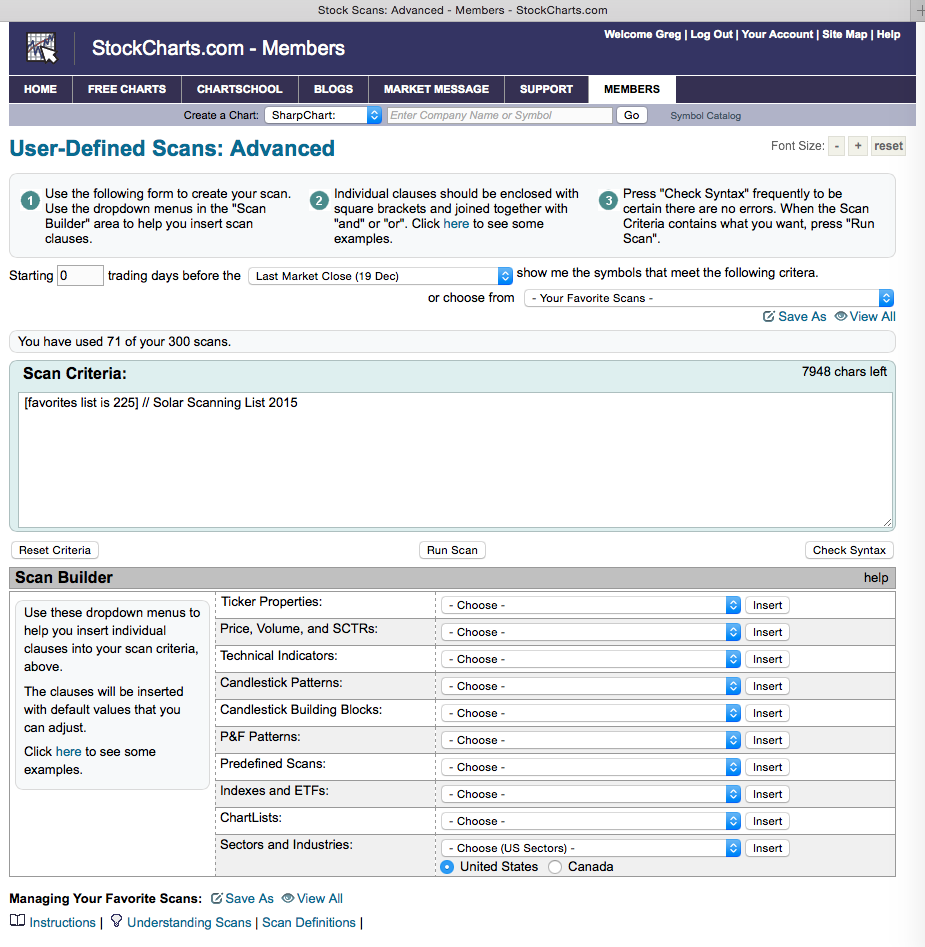
So that will be our 'Solar Scanning ChartList 2015' template. If you have other ChartLists you want to use to do scans, you would just change this line. How easy is that? Pick from the dropdown list below.
Now let's scan for a simple MACD crossover. We want it to give results that happen today. So we need to set up a few things. In the page below, I selected the MACD line and inserted it into the scan box. I have now highlighted the MACD signal line and I am going to insert that into the scan box as well.
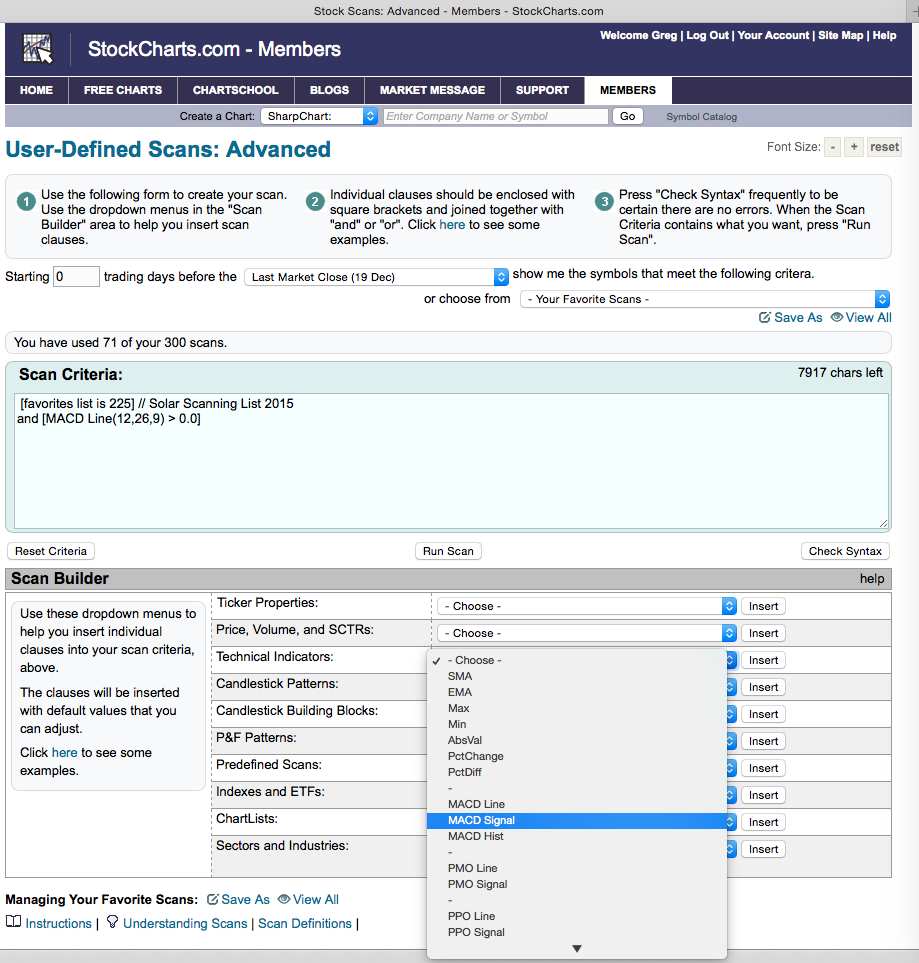
So in order to make the MACD give us a technical sign that we can use for trading, we need the line to cross above the signal line. We need the MACD line to 'cross above' the MACD signal. How hard is that to write into code? We use an 'x' to say cross above.
So I have placed the original clauses and the modified clauses in the scan box so you can pick your style. I have put '//' - two slashes - in front of anything I don't want the computer to read. It thinks it is a comment and ignores it. So originally, I used the two different MACD inputs to get some code to work with. I don't have any slashes in front of them right now to demonstrate how they look when inserted, but the current clauses would only help us to find when the MACD line was above zero and so was the signal line above zero. That is helpful but not really timely. We want to know when the MACD crosses above the signal line. So, I copied the clauses and altered the copies below so you can see my changes relative to the original. This would not run as a scan yet.
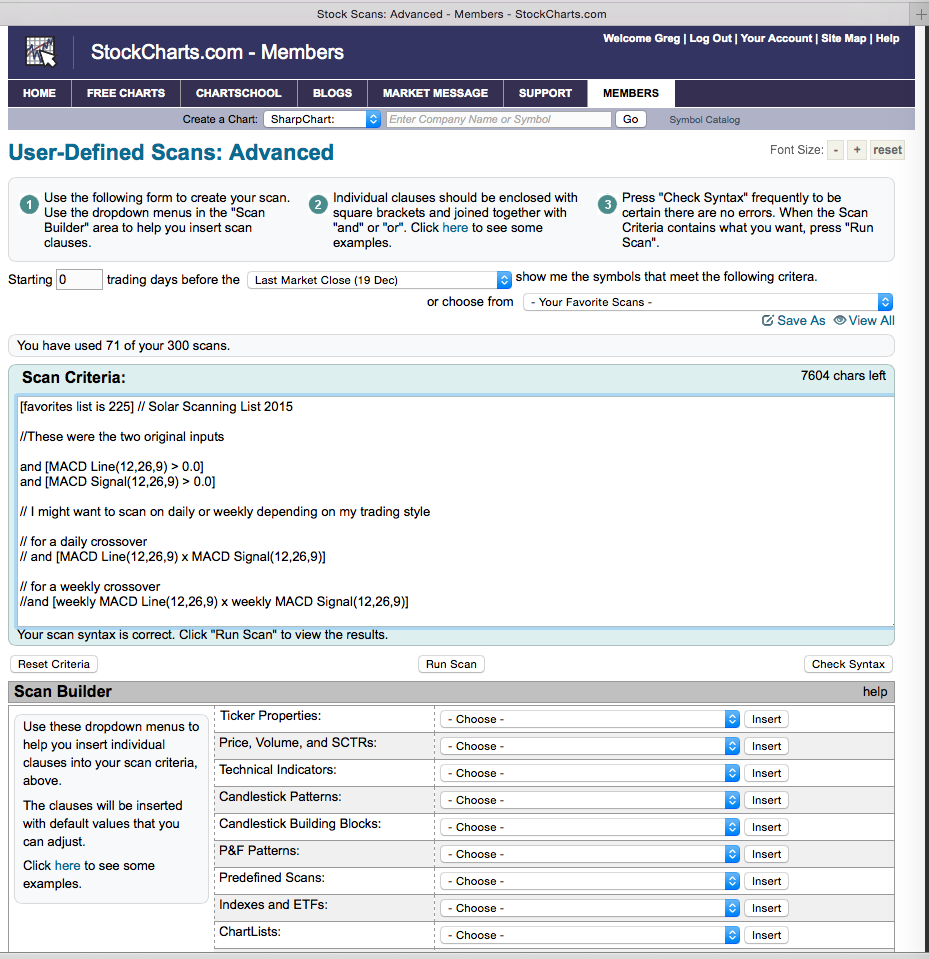
To get a daily MACD line 'crossing above' the MACD signal line we would edit the inserted code by changing to the following:
"and [MACD Line(12,26,9) x MACD Signal(12,26,9)]" where the 'x' in the middle represents the crossing above.
If we wanted a weekly version of the same signal:
"and [weekly MACD Line(12,26,9) x weekly MACD Signal(12,26,9)]"
So below is the way it would look if you run the daily. You can copy this text and paste it into your scan box window. That's it. The first line has no 'and' in front of it so it is the first active clause for the scan engine. The second line has the slashes to comment what this scan does so you can remember in the future. The third line has an 'and' in front of it as it is not the first clause.
That is all. Copy everything between the top two lines for daily or the next two lines for weekly. Copy and paste it all in to your scan box.
[favorites list is 225] // Solar Scanning List 2015
// for a daily MACD crossover
and [MACD Line(12,26,9) x MACD Signal(12,26,9)]
This is how it would look for a weekly crossover.
[favorites list is 225] // Solar Scanning List 2015
// for a weekly MACD crossover
and [weekly MACD Line(12,26,9) x weekly MACD Signal(12,26,9)]
The result should look like this.

or for the weekly,

OK. I feel we have that nailed down. It never hurts to click the "Check Syntax" button to see if you have it right. Then above the scan box on the right, you can save as 'MACD crossover scan' or 'Weekly MACD crossover scan' or save both. If you wanted to scan for a positive MACD crossing above zero today, then the scan would look like this instead.

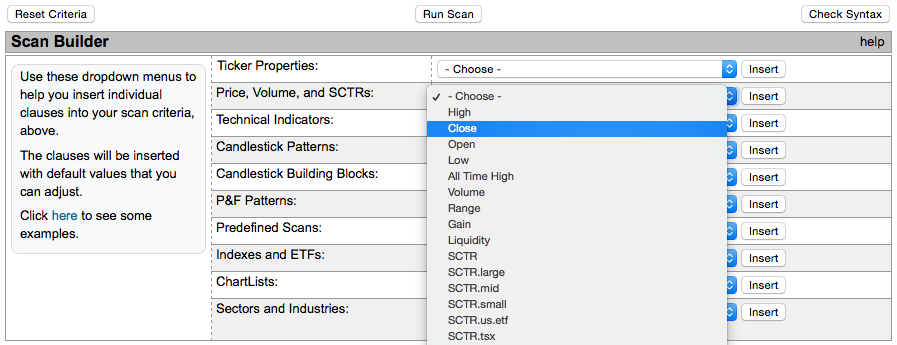
Now, it gets interesting. We can scan for whatever we want. Here is a method for finding a 'cross above' the 50 DMA. So the clause is a Price indicator. Go select 'Close' from the 'Price' dropdown. Click Insert.
Then select 'SMA' from the 'Technical Indicators' dropdown. Insert.
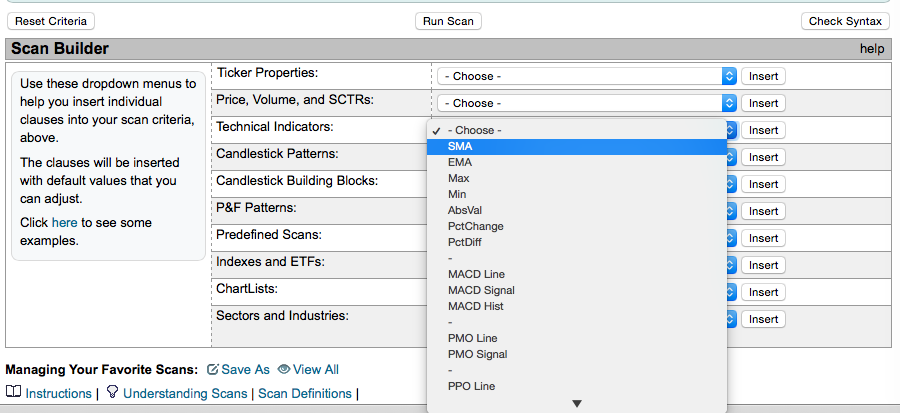
Then modify the two clauses so we create one clause that looks for Close x SMA(50). You always need a square bracket around a clause. Click check syntax to make sure things are ok.

Now one of our other tests was for a stock in our ChartList making 52 week highs. Here we are going to borrow the code from the predefined scan list. This one is actually a 1-year high as it uses daily.
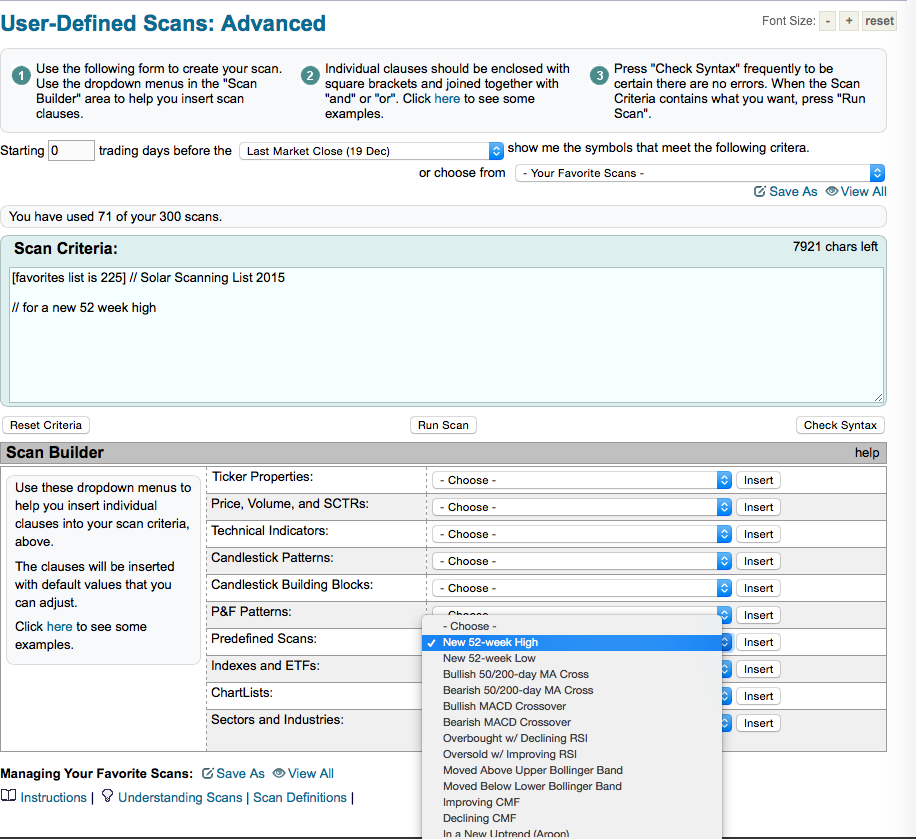
Here is the result in the scan box.

How would you change this to only get 26 week highs as an example?
How about a scan for an SCTR moving above 50?

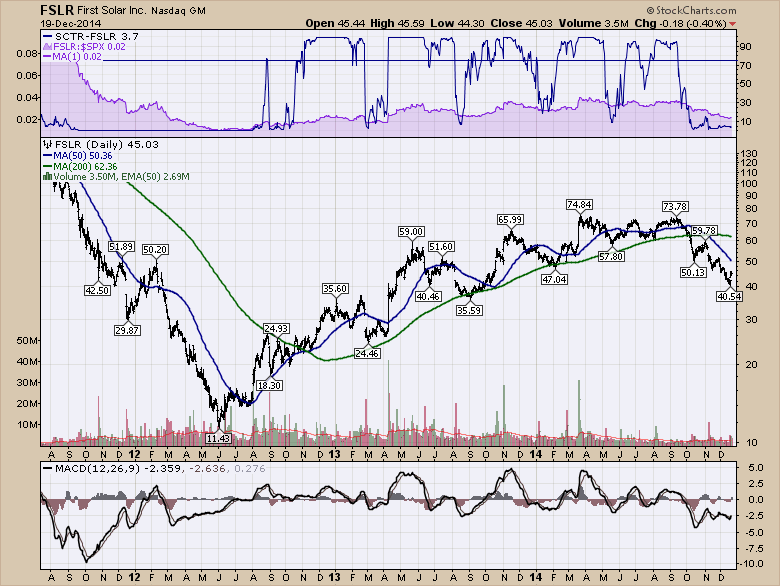
This could be used anywhere. You could also change the number to 75. I really like when an SCTR crosses above 75. It shows a really strong stock. Maybe a positional trader will wait for that. Notice when First Solar (FSLR) moved above 75. Is that soon enough for you? Just look at a few previous charts to decide. Go check a string of stocks like AAPL, GOOGL, AMZN, GILD, CELG, XOM. Walmart (WMT) seems to work better at 50. You choose what you scan for. These are tools for you to adjust for your trading style. Here is an SCTR on First Solar.
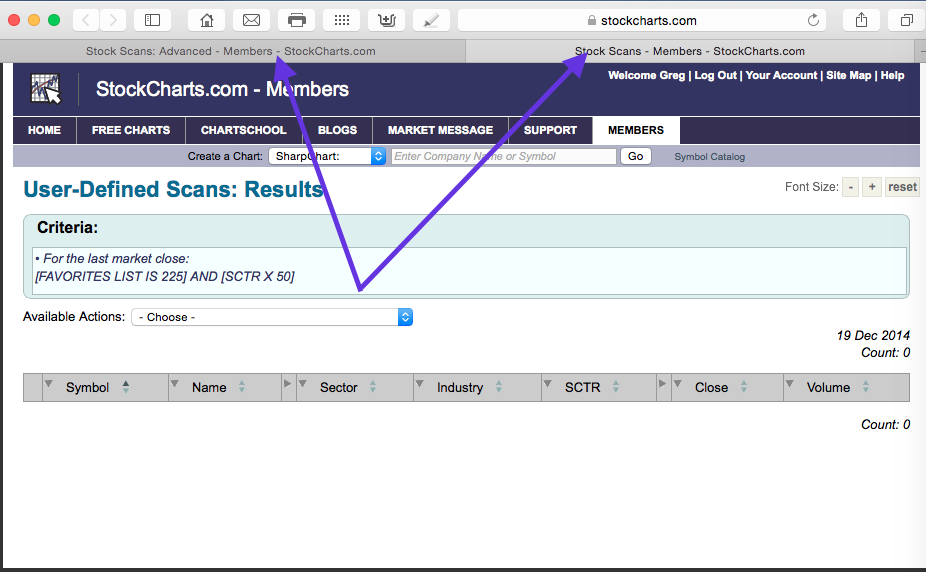
The most important thing to note is when you run a scan, it puts the results in a new tab or window. It does not write over the scan tab you are working in. So look at your tabs or windows. The next two pictures show the change in tabs. When I am in my scan engine below, I only have one tab open. That is hard to notice but compare to the second picture below this one.
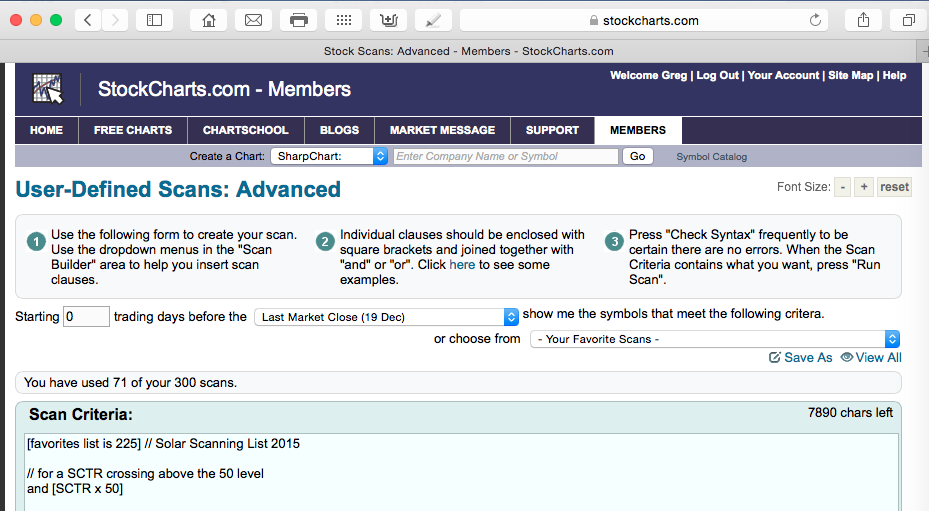
Notice what happens after I click 'Run Scan' in the middle under the scan box.
I now have 2 tabs. Looking at the resulting page, there are no stocks in the Solar Scanning List 2015 ChartList that have an SCTR greater than 50. They are all still weak stocks. So the answer is zero in this case. If I ask for how many stocks have an SCTR greater than 1, I should get a list of stocks with an SCTR greater than 1, but remember some stocks don't have an SCTR due to size. They won't show up.
Some of the solar stocks had positive daily MACD crossovers this week. The search engine will only return today's (the last trading day's) crossovers. You can work backwards up in the top left corner by changing the zero to any number of days back to start. Change the number, then click 'Run Scan'. This is the box to change on the Advanced Scan workbench above the scan box.

I am not instructing you when to buy these stocks or any stock because you have to decide what style you have for investing. By picking the indicator signals you want to use, you can search for them. To find your style, go back and look through other bottoming and topping sequences on different charts (oil and gas stocks, biotech) to help you decide. This series is about the tracking process to find stocks that you put in a working ChartList that will trigger a signal for you. I picked Solar because of the big moves, the manageable list size, the size of the opportunity and recent history over the last few years. I have longer lists of stocks in other ChartLists that we can use this same process for and you can imagine that the scan engine would be very helpful. This process is not exclusive to solar stocks is the point I am trying to make.
OK. I'll end this chapter here. The important thing is to either visually scan or use automated scans to find your trade signals. You can alter which ChartList you look at to run your scans against for particular industry groups you like. You'll notice you can get a dropdown of individual industry groups in the lower part of the scan page down by where we found our solar ChartList. You can scan for anything like 4 day pullbacks, etc. Read the scan blog by Gord Greer for great ideas on scanning. Use the prewritten code straight from the scan engine writers and save it to scan on your specific ChartLists. If you change the parameters to fit your investing timeline and run the scans against your specific ChartLists, you'll be aware when things are starting to move. You'll see many charts change at the same time which is a powerful clue when the time is right for your style of investing. That makes scan usage very valuable and very easy! We have now found scans for the 52 week highs, crossing a 50 DMA or 200 DMA, an SCTR or other technical points like a MACD.
Good trading,
Greg Schnell, CMT

