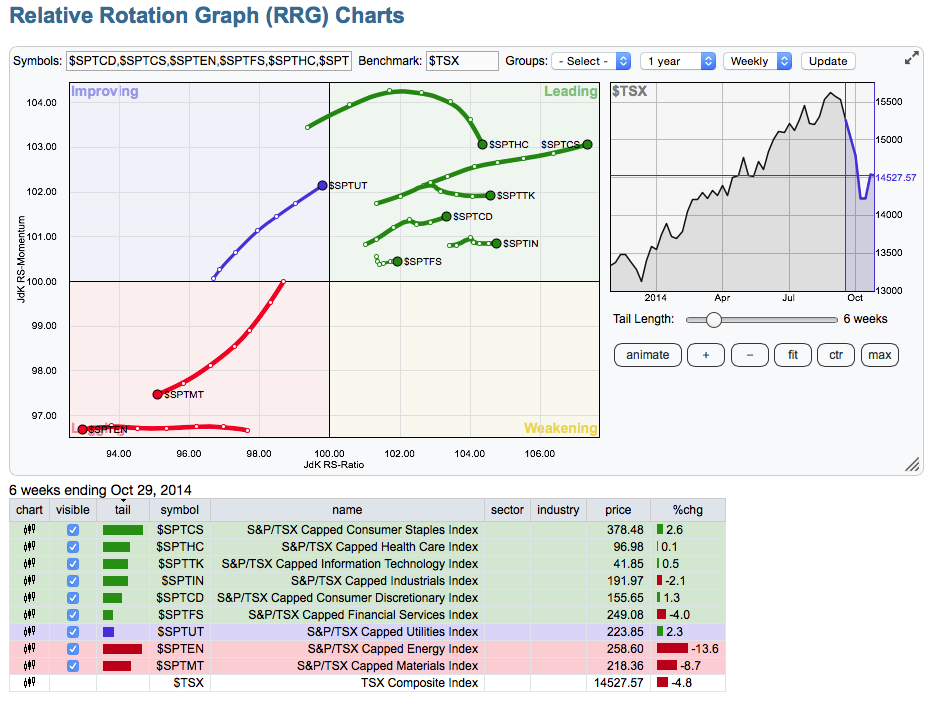
The RRG Charts are going to be part of Thursday's webinar. The value of these charts is unbelievable. Here is a sample of the Canadian Sectors RRG Chart.
The $TSX is the benchmark in the box above the green area of the chart. So it is the average. That means the Energy and Materials have sold off so hard, that they can balance the other 2/3's of the index weighting. The table below the rotational chart shows you the ticker name and the detailed name of the sector. The Utilities are about to accelerate into the positive momentum and positive relative strength so they might be a sector to drill into.
Here is the link to the live chart.

Based on this chart it is still way too early to look for success in the energy and gold sectors.
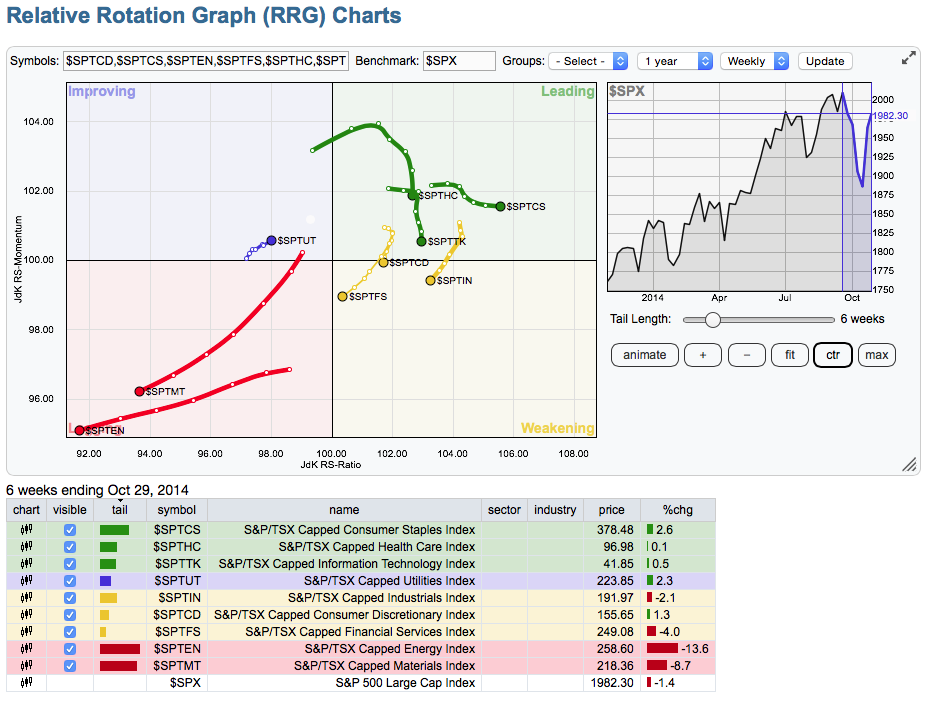
Now let's compare it to the $SPX in Chart 2. Here is the link. Notice a few major things. Financials, Consumer Discretionary, Industrial are all losing momentum (because they are moving down) and losing relative strength (because they are moving from the right towards the left). When they start to under perform both in terms of momentum and relative strength that is an important time. So the only sector with improving momentum is the Utilities and the relative strength is also improving on the Utilities but the $SPX is still outperforming so this appears to the left of centre. The Technology, Health Care and Consumer Staples are losing momentum( moving down) but they are still outperforming the $SPX (Moving to the right).

I spent a few hours with Julius De Kempenaar in Amsterdam and I plan on demonstrating some of my analysis on how I would use this to help pick stronger areas of the market.
So for the webinar tomorrow afternoon, we would love to have you attend. You can Click Here To Register. Please click to register only if you are attending live. You do not have to register to watch the webinar later.
The start time for the webinar will be Thursday October 30 at 4:30 EDT, 1:30 PDT.
It will be posted on the lower part of the home page for viewing afterward. See the example below. Notice the last line.
Good trading,
Greg Schnell, CMT

