It is the season for the bears to be out roaming looking for blackberries in Canada.

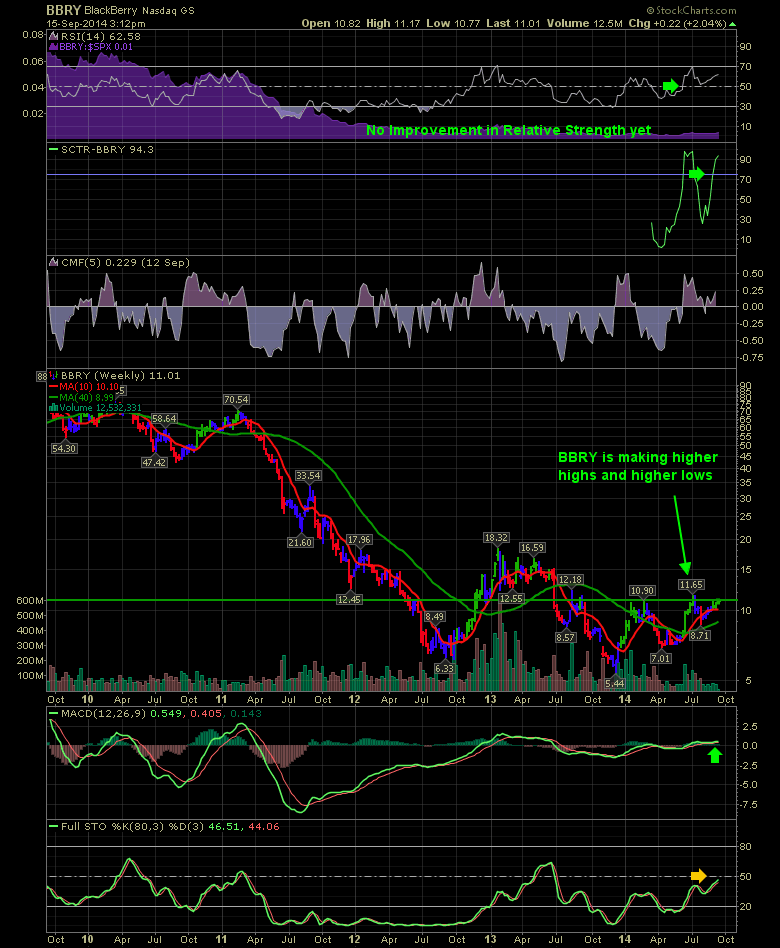
The corporate Blackberry (BBRY) seems to struggle with the grip the bears have too. This double digit area on the chart below is a big problem for BBRY as the $11 level has been significant resistance over the last year. There are numerous events on the chart that make it interesting here.
First of all, the RSI spending some time above 50 on the weekly is a nice bullish trait. There is a marginal improvement in SPURS shown in purple. I notated it as "no improvement yet" on the chart, because it is almost negligible. The SCTR did a nice push up, then a pull back and has now reentered the top quartile again. I like to see that SCTR action. That is very bullish. The Chailkin Money Flow (CMF) has stayed positive for 3 months now.
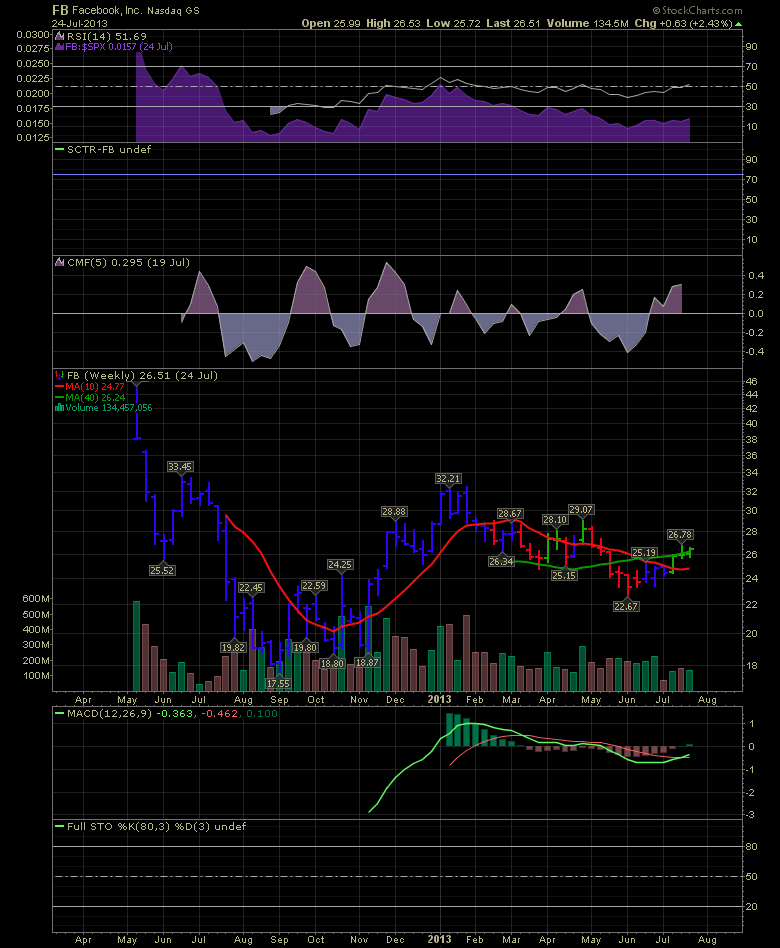
While Blackberry is at least making higher highs and higher lows now, this base structure looks like a typical Wyckoff base structure. It reminds me a lot of the FB base just before it broke out. I have put the Facebook chart down below so you can compare.
July 2013 BBRY : July 2012 FB
Nov 2013 BBRY : Sep/Oct 2012 FB
Jan 2014 BBRY: Jan 2013 FB
April 2014 BBRY: April 2014 FB
In July 2014 BBRY tried to breakout, where FB was slowly climbing in July 2013. Facebook went on to breakout during earnings. Will Blackberry breakout during the Sept 26th earnings announcement?
It may appear that their corporate connectivity strategy is starting to hold the investors interest.
If we can breakout, this has all the makings of a successful base.
Good trading,
Greg Schnell, CMT


