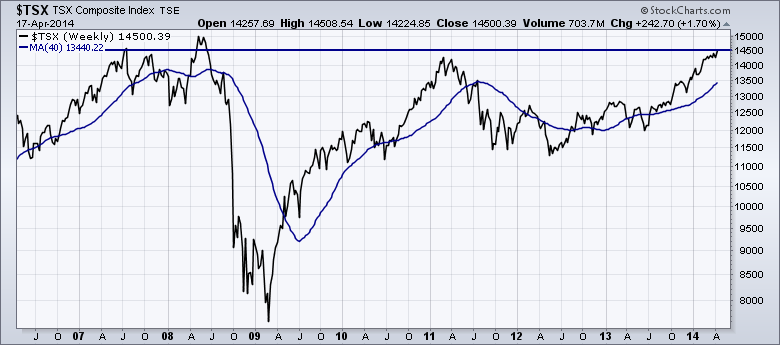
The $TSX is taking over leadership here. While I couldn't be more bullish on the energy sector here, I can't help but stare at the $TSX and wonder if the former highs will be resistance.
Here is the weekly long term view.
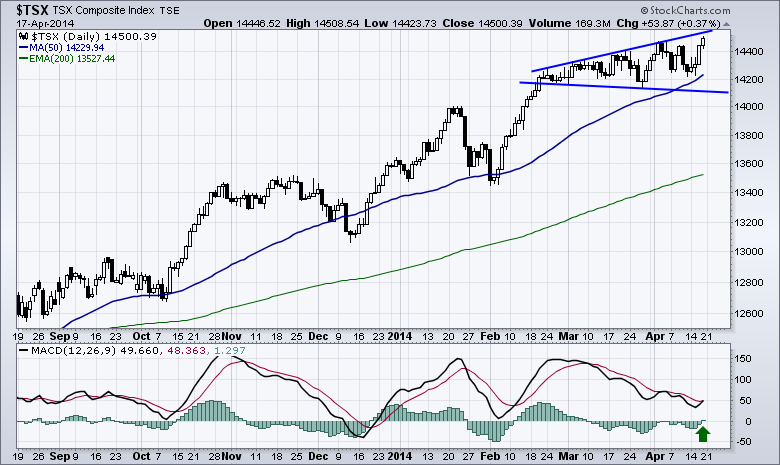
Chart 2 is the daily view. We had a nice bull candle breakout to a new high to close out the week. Watch closely to see if it holds. We closed at 14500. 14646 was resistance in 2007 and 15154 was the top in 2008. If the US market does roll over and pull back hard, I would expect the Canadian market to pull back as well. The recent euphoria on a weekly chart is huge and due for a rest. If the market is pricing in a lasting disagreement with Russia, we might find oil and gas soaring to new highs, but pressure showing on other areas.
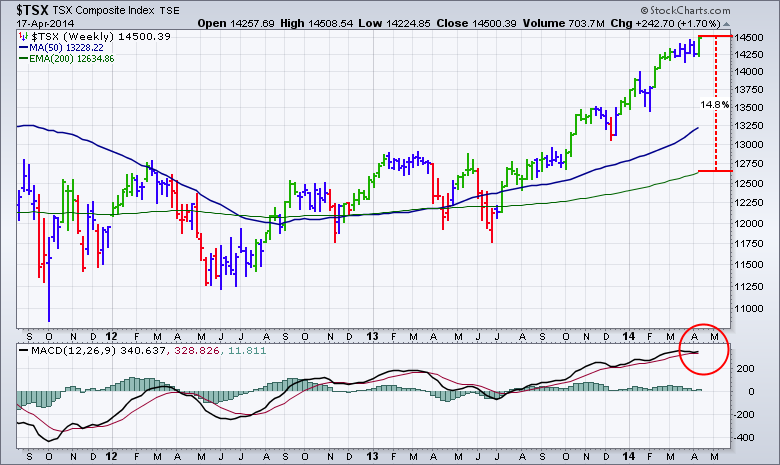
We are almost 15% (14.8%) above our 200 DMA as shown in Chart 3. That is heady. The time for tight stops is in order to protect gains.
I plan to stay in if the gains keep accumulating. The stops will kick me out soon if they don't.
Good trading,
Greg Schnell, CMT
We try to keep our articles informative and entertaining. Make sure you check out the other blog writer articles in Mailbag, Chartwatchers, Traders Journal, Decision Point and The Canadian Technician. All of these articles are free to subscribe to. The subscriber button is top right on most articles. One of the little known secrets of StockCharts is our Blog or Articles section. The Blog tab will bring up a view of some of the most recent articles. StockCharts.com Subscribers have two additional daily feature articles.
Lastly, Chartcon 2014 in Seattle is rapidly booking up. Click here for more information.


