OK. The number of locations breaking out to new highs is consistent with a new bull market.
Let's roll through them.
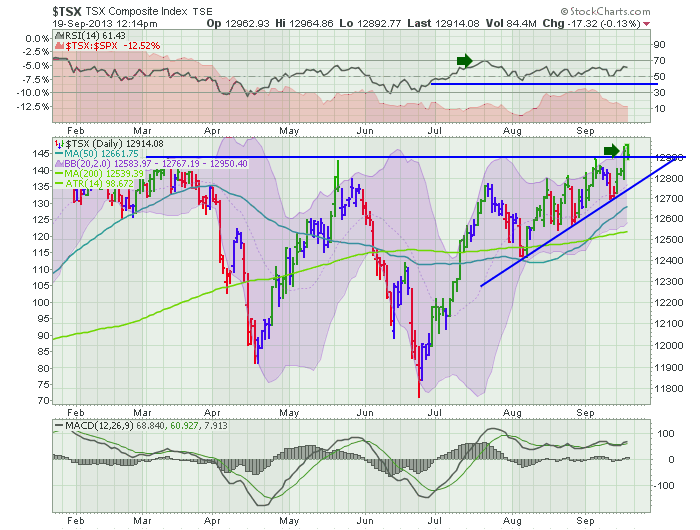
Without charting the $SPX, $INDU, $COMPQ we know they are at new highs. Look at the $TSX.
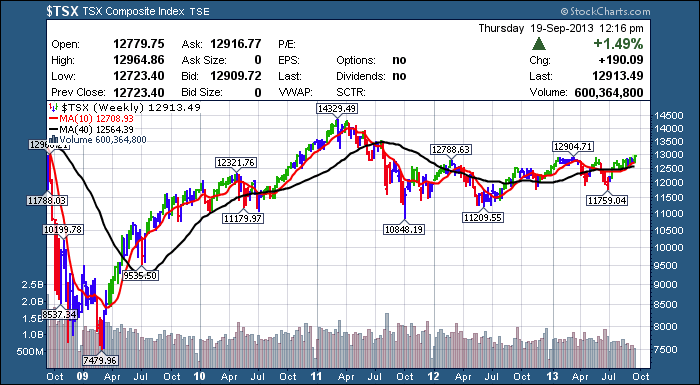
Here we have the $TSX at new highs above the 8 months shown as well as the last 2 years. Notice how the $TSX touched the 70 in July on the RSI. That is a bull market reading. The current breakout above May highs is bullish! That is confirming the US breakout of a couple months ago.
Let's look at the dailies for a few of the others. Remember Europe? It was supposed to fall apart.
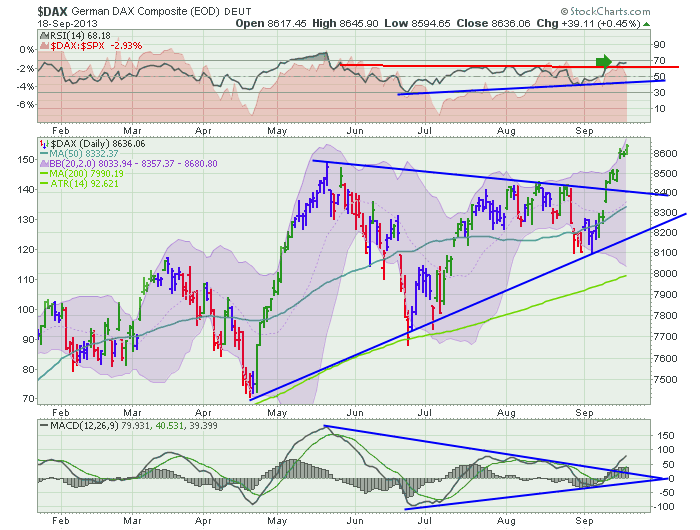
Let's review the $DAX chart. THe RSI is breaking out to new highs after touching 30. This is bullish behaviour. The RSI tested 40 and is now rising off that level to new highs. The MACD has confirmed the breakout. The price action tested the 200 DMA and found support there in June. The lower highs in early August were concerning. The higher low in September is bullish. The breakout above the downsloping trendline is bullish. The fact that we have moved above the May highs is confirming the US breakout. Bullish.
The $CAC chart has been under terrible pressure. It is sitting in the bottom right corner of a 5 year chart.
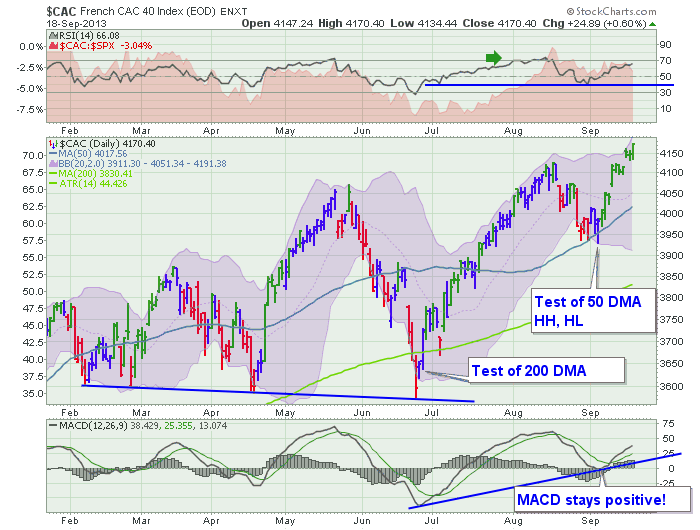
But after making larger and larger oscillations from February to August, the behaviour of the $CAC index changed in early September. It made a much higher low, finding support at the 50 DMA for the first time. It was in a pattern of higher highs and lower lows. Usually bearish, this worked out paradoxically. August broke above the May highs and now we have higher highs with the first higher low. This is bullish. The MACD finding support at the zero line and staying positive is very bullish.
London isn't as pretty, but lets look at it.
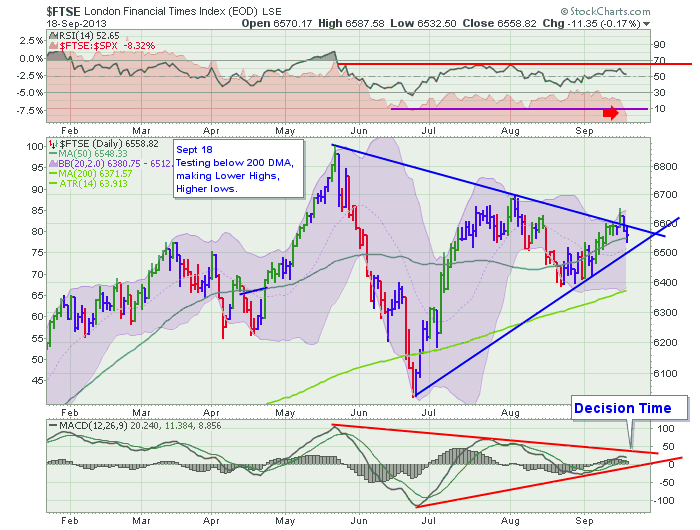
The $FTSE has not been able to make new highs yet. It needs to get above 6700 to start making higher highs off the late August higher low. The RSI recently found support near the 40 level so that is good, but it has not broke above the 65 level to confirm the shift to a new bull market. The MACD is pointing to a decision soon and I would expect it to follow Germany and France.
OK, North America and the Major European Indexes are breaking out to new highs, with the exception of the $FTSE. What about Asia? Well, let's start with the Commodity supplier Australia.
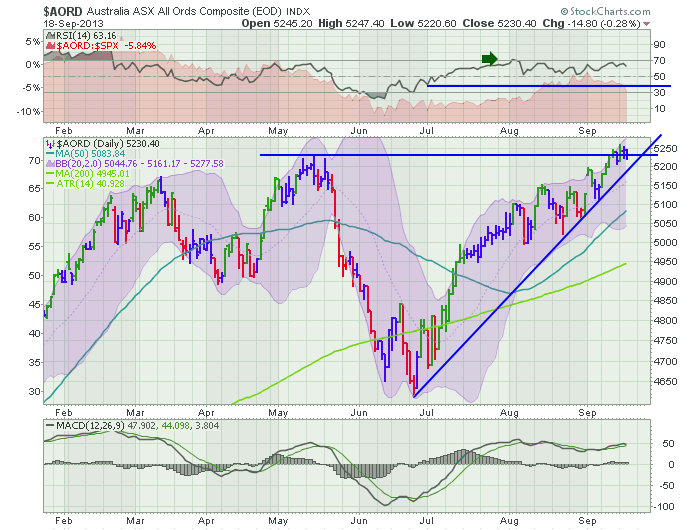
The boys down under are moving up top. They are breaking out to new highs! They are following the RSI signal when it touched 70 and are continuing to new highs. The MACD is very bullish. When an index is making new highs, it is not in a bear market.
Lets look at China.
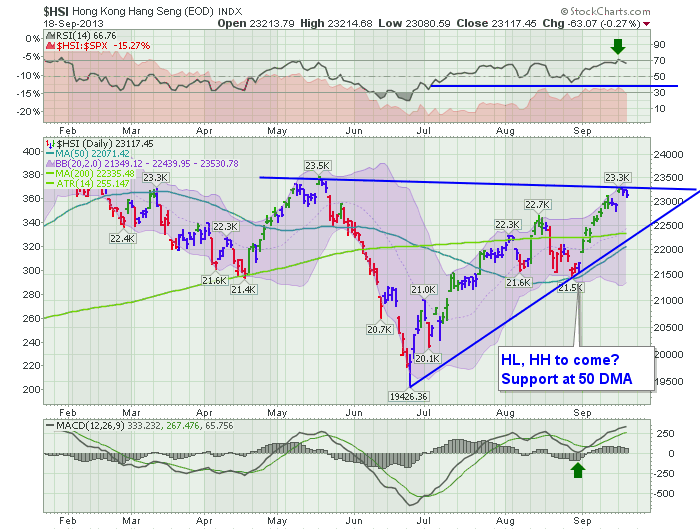
This chart won't update till end of day. The $HSI closed at 23500 today. So it is at level with the previous close back in May. The RSI has touched 70 after bouncing off the 40 which is bull market price action. The MACD got support above zero, and is making the highest momentum in 8 months. That's bullish.
Here is the $SSEC or the Shanghai Composite.
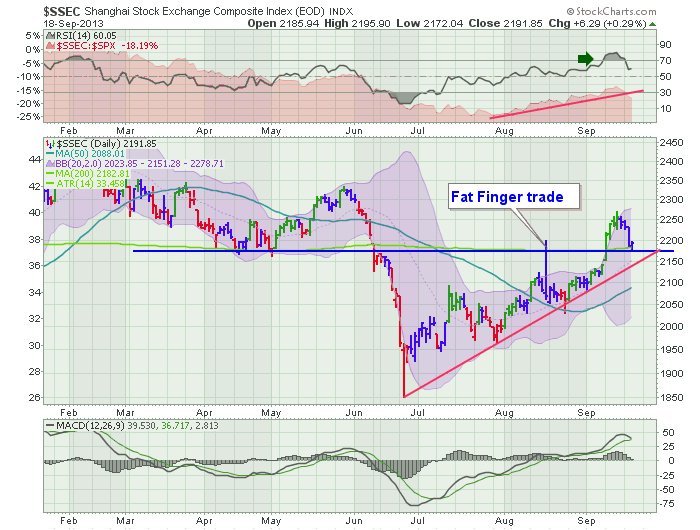
The $SSEC market has broken above the the blue resistance line. The RSI is in an uptrend and has touched 70 so it is in a new bull market. The RSI finally broke above the bear market RSI pattern which was signalled in April. After the RSI went to 30 and could not get back above 65 in May, the RSI plummeted. After sitting below 30, it rallied up to 50, found support at 40 and worked higher. It struggled to get above 60 in August but we have now broken out of the bear trend on the RSI. Bullish!
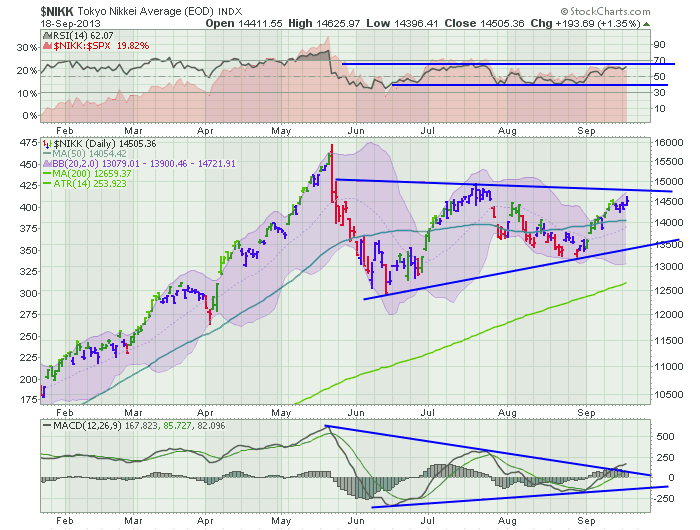
Here is the Nikkei in Japan.
The RSI is rangebound. The Price action is range bound with higher lows and with lower highs. The MACD is saying topside breakout. The $NIKK closed at 14776 today which presses against the upper trendline.
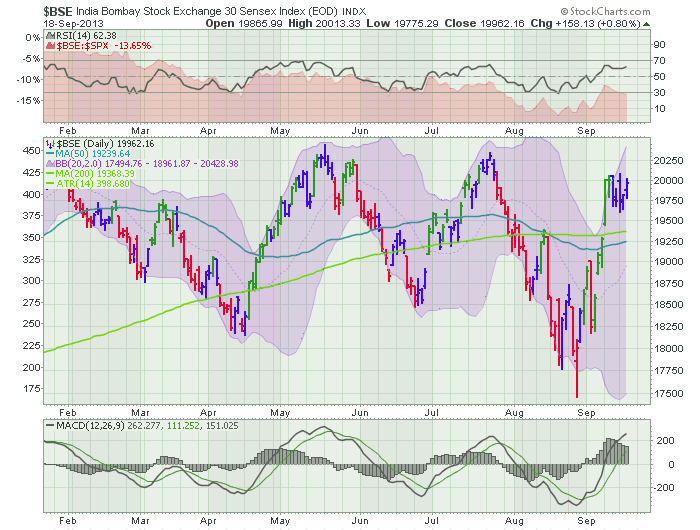
Lastly the Bombay. This chart is not nearly as bullish. The RSI has been down to 30, so that says bear market. The RSI has been stuck under 65 which is bearish. The price action is making lower lows. The MACD has reached above the July peak, so that is bullish. But the response to the fed meeting, which won't show until later today takes the Bombay to new highs. 20646 is the close. That takes us above all the prices on this chart! Bullish.
I could go on, but the world is trying to move higher. If this collection of signals isn't bullish enough for us, we probably will be waiting for a while. In my gut feel, it doesn't feel right. The $VIX is very low and usually oscillates on options expiration day which is tomorrow. I would normally expect the $VIX to shoot up and scare us. But the price action data worldwide says higher. If we were waiting for breakouts, we got them.
Lastly, this global move could fail and would probably show up world wide. I have CNBC on in the background, and they are currently running to the debt ceiling as the new fear campaign. Have we gone too far too fast? Mr. Boehner is the next block. Bottom line for me, ignore the news and buy the charts. That appears to be what investors are doing.
Good Trading,
Greg Schnell, CMT

