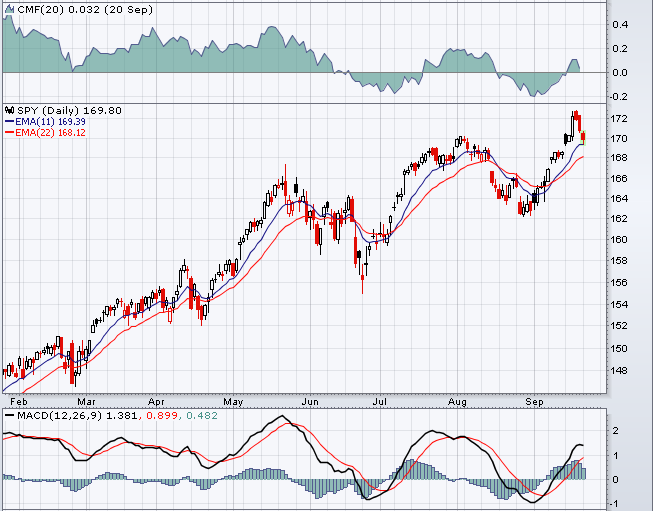
After coming back from NYC, it reminded me to review some of the subtle data in the sectors. Here is the SPY.
So, what is the sector breakdown? That gets more interesting to see what is leading. Lets go through the sectors.
I wanted to show two things here. First, how to do it longhand. Second, the value of gallery view.
If you wanted to look at CMF for the sectors, this is how you could do it. Take a snapshot of each one, and compile them manually into a screenshot.
At the bottom is the chart of SPY (so you can see the CMF in the $SPX tracking ETF). Now this is the CandleGlance view that you can access from the free charts page. I have added one indicator, the Chaikin Money Flow with the default settings. I set the chart duration to '1 Year', but could have chosen 6 months, 2 months or even PnF charts.
Lastly you can also view this by making your own CandleGlance View.
This allows you to set up all your favourite settings in one view. So how can you set this up? Size is limited so get very choosy on what you want to see.
Get a chart looking the way you would like it to look with the appropriate indicators and overlays. Set the chart size to 360. Last thing to do is to save it as a CandleGlance chart style. Your setup would look something like this.
The important part is to click 'Add New' on the ChartStyles line. (Right up at the top, 2nd from the top). It is important that the Chartstyle name is exactly like I have written it there. Type in 'CandleGlance' with the capitals.
So: Add new
Type In: CandleGlance
Save!
Ok. That is the 'how to' on this. But more importantly, the money flow has been declining as we go to new highs in all of the leading sectors. It looks like the market may need a pause here and we'll watch the strength of the bounce. I continue to look to the rest of the globe and we'll see if it can continue to move higher after breaking above resistance last week. Only 6 of 9 sectors have positive CMF or Money Flow. That isn't bullish. The other three are rolling over just above zero.
Good Trading,
Greg Schnell, CMT


