While I was flipping through the charts this weekend, I couldn't help but notice there were so many interesting charts to share.
As examples, the $FTSE did a perfect backtest on its breakout, $Lumber is climbing above 4 weeks highs but still below the 200DMA, $Copper has a double bottom, $Gold finally made a higher weekly level to name just a few.
But lets focus on $NATGAS to continue our Energy theme with the Frackers, Drillers and Senior Production companies from the last blogs.
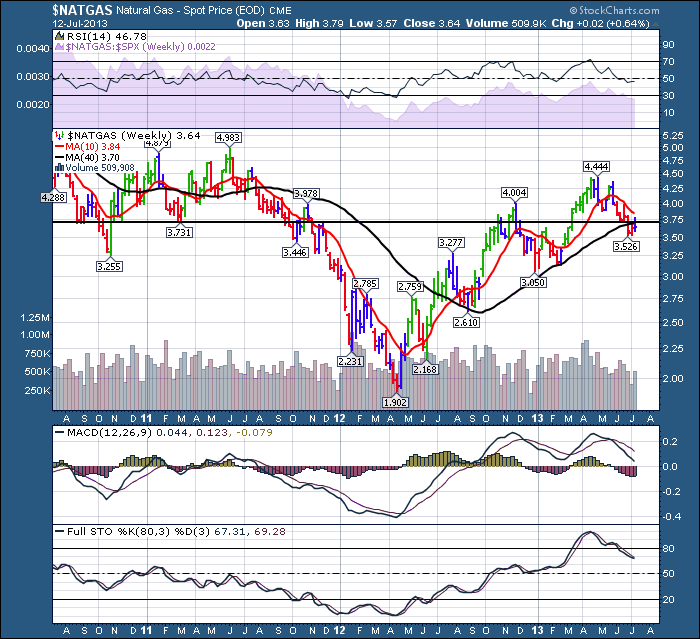
Here is the $NATGAS chart and why I think it is so interesting right here.
After $NATGAS suffers its traumatic decline in 2011 and 2012, it makes a series of higher highs and higher lows over the last year.
The support level at $3.70 - $3.75 is currently being tested after the breakout above resistance in March. We can see a series of higher highs and higher lows since that stab down to $1.90. What makes this more interesting is that in the last few weeks, $NATGAS has traded and closed under the 40 WMA for the first time since July 2012. It is also testing the former support area from the bottom side for the first time since March. Interesting that during this week, the price action moved above the $3.75 support line and the 40 WMA but fell to close below both lines. That adds caution for me.
Lets look at the indicators. RSI still very bullish, The SPURS (purple area) is a little weaker than it has been, but really on par. The volume has diminished on the pullback. The MACD is still very positive and has a small negative divergence with the last peak being the same elevation as the former, but you can see the price was higher. Not major in my mind yet.The full sto's falling below 80 is a little more concerning. This may be losing enough strength that a more significant pullback is in order.
If I owned it, I would try to buy a little protection, but the rest of the oil and gas sector is looking more bullish. $NATGAS is at a very interesting place and worth watching for more clues.
Good trading,
Greg Schnell, CMT

