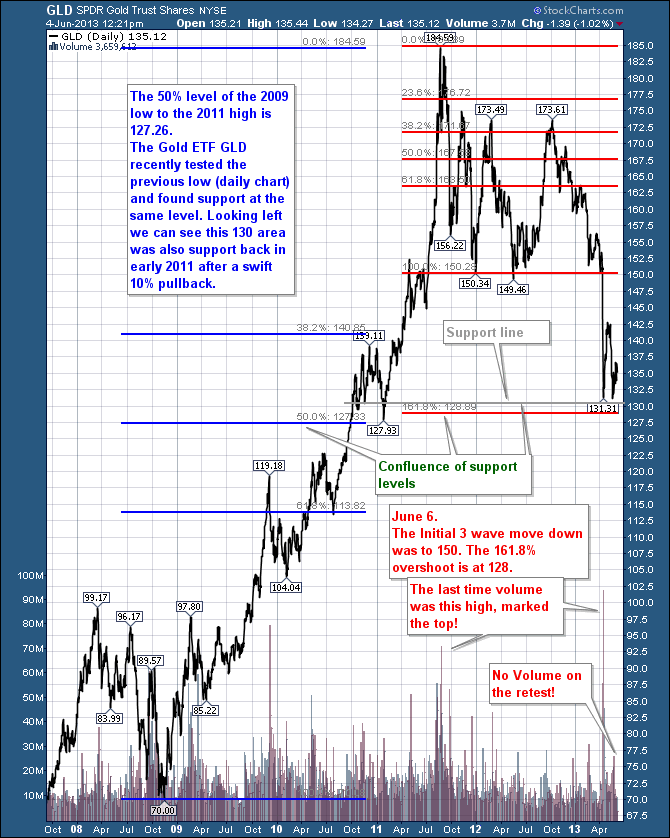
First of all, trying to trade bottoms in volatile commodities is filled with risk. Managing this risk is important. I wrote the Part 1 blog yesterday that can be found in the Canadian Technician section under the blogs tab. With that, we'll look at the Gold ETF with huge daily volume, the GLD. I try to put links to the charts so you should be able to click on them and expand the size.
Let's look at the big picture. The 2008 high to low was a 30% pullback to $70.00.
From the low which showed up in Oct 2008, GLD went on to make a slightly lower low 3 weeks later (NOV) at $70. The first was the momentum low, the second was the final low. From there, it was a rocket ride to $185 in less than 3 years! YAHOO! Well, once the top was in, it marked a significant high. The euphoria was huge. At the time Silver was moving 10% a week. Gold was moving 10% a week! I'll zoom in on the 2008 low later in the week. Let's work through this chart first.
Using Fibonacci retracements, there are three common levels of retracement. 38.2%, 50% and 61.8%. Obviously, there can be 100% or more, but the common retracements are as listed.
After the parabolic spike top,where the TV anchors were using the word gold every 10 minutes, the sellers had no one to sell to and the market plummeted. The classic 3 wave corrective pattern found support at 150. This set the low of the range. You can see the sudden vertical spike up (173.49) that literally exploded back the most recent rally high (The 'B' wave high of Nov 7, 2011 in Elliott terminology). This spike test finished in March of 2012. So this chart makes everything look parabolic but the rallies and pullbacks took about 6 weeks each. GLD found support at the same lows while the miners were making lower lows on each subsequent test. The miners were also making lower highs by this time as well. The final move to resistance in Sept 2012 marked a significant test. When it failed there, it stairstepped lower. When it got to the support level of 150, it tried to bounce but quickly rolled over and plummeted on April 15. It made a move below support of 61.8% of the initial correction. Within a $3 range on a huge move is pretty close for my math. I have shown this with the red fibonacci lines that have the 161.8% fib line shown.
You can see the move from 2008 to 2011 seemed vertical. You can also see the blue fib lines and the 50% retracement is at 127.33. So a strong place to look for support is at 127.33 and the market pulls back to within a few dollars of it when it seemed to be in freefall.
Lastly, when the market is falling, aggressive investors will look left to see where previous support and resistance is. The grey line shows the $130 level as having good support.
The combination of a 50% retracement, a 161.8% move of the initial corrective pattern and the previous support around $130 make a compelling case for a support location. After the initial thrust down, will it hold?
After the April 15-17 collapse, the market tried to rebound. A good low usually has a retest. The pullback in May went down and tested the April low. Importantly, it held! Here we sit a few weeks later, pondering Gold.
Let's quickly look at the volume. On the break of support, selling volume flooded the market. It was aggressive. In fact it was so aggressive, the last time we saw a volume spike that high, it marked the other extreme in the gold market...the final high! So again, anyone who was selling, probably sold out on that day. When we look at the volume on the retest of the low, it was minor in comparison. It would be safe to say that the majority of weak hands have been shaken out!
So, is Gold's final low in? Great Question. We won't know for sure until the days ahead unfold.
Lets summarize.
We have capitulation volume, we have three different reasons to find support at the 130 level, and we know that Gold has made important bottoms in May before. We have a retest of the momentum low occurring 3 weeks after the low and it held so far.
Tomorrow, I'll highlight the interplay between the GLD and the GDX as well as examine the 2008 Gold Bottom for clues that we may use in 2013.
Good trading,
Greg Schnell, CMT

