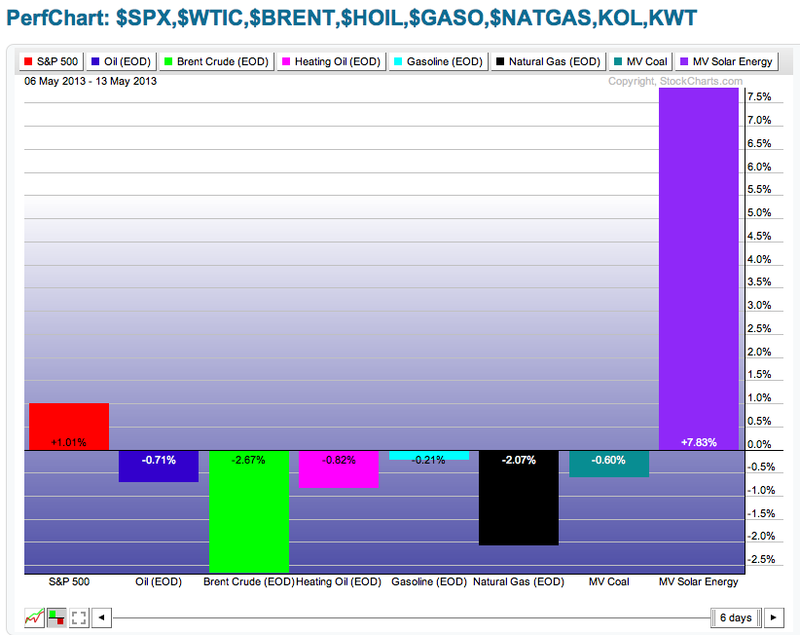
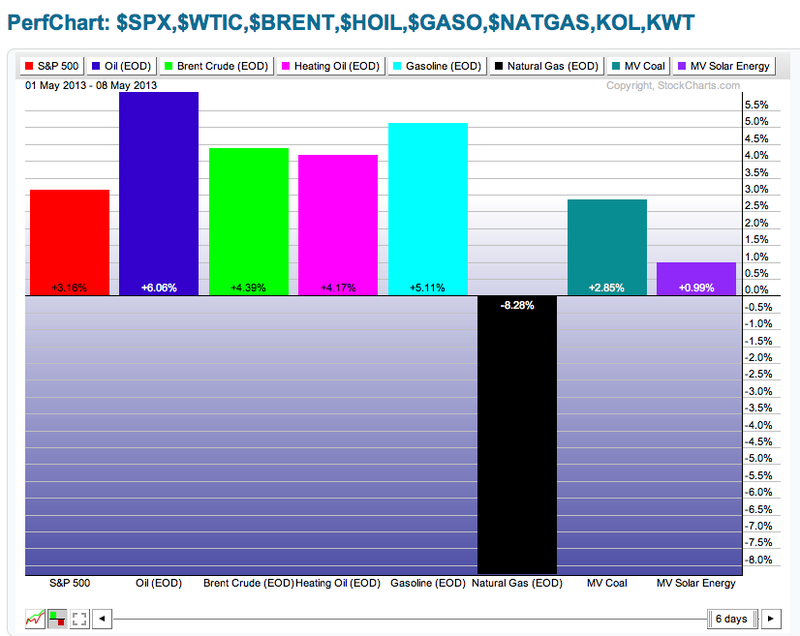
This is the picture of how the energy markets have performed over the last 6 days.
You will notice the date in the top left corner. This chart included the Monday May 13th close.
The $USD recently went on a tear over the last few days.
Look at the same chart with a date almost a week ago. This was as of May 8.
These markets moved significantly when the $USD currency pairs broke out on the charts. I do not see a linkage between the Solar ETF and the currency.
If you open a month of data, the $USD trended in a range and the commodities worked slightly higher. But when some major support areas on the Aussie and the Yen broke, these commodities really moved.
Its not a daily correlation, but these commodities pushed down hard when the $USD made sudden moves higher.
Good Trading,
Greg Schnell, CMT


