I think even James Bond might have been rattled by the moves in commodities today.
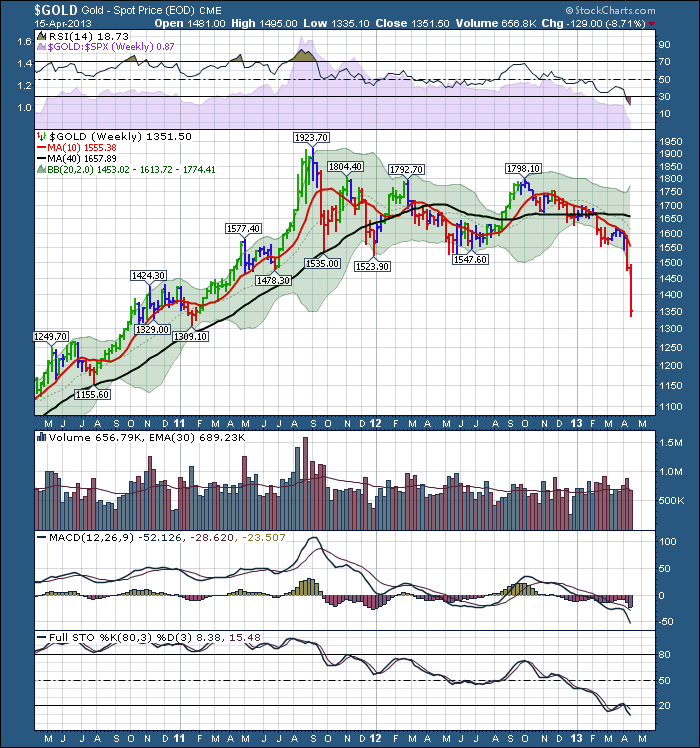
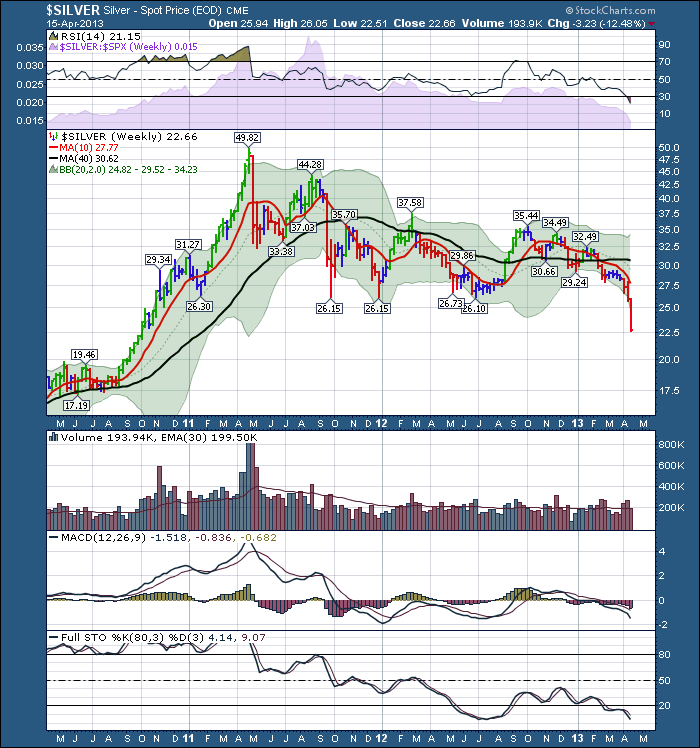
Margin calls rolled across Silver and Gold. Natgas , Silver and Gold all had changes in margin requirements announced by the CME. Copper made new one year lows, but closed above the level.
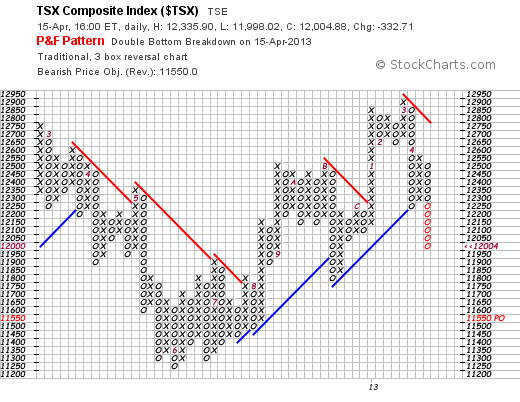
The precious metal companies were crushed. The NUGT 3X ETF lost 50% in a few days. The miners were taken to the boiler room. TCK/B.TO made 4 year lows today but managed to close above the previous lows. $TSX looked like a tornado hit it, as it swirled down continuously into the close. We would have to say wow! If there was a silver, concrete lining, it closed above 12000. Lets plow through some charts.
You can see the substantial breakdown that occurred and how pivotal the Friday close was.
Silver
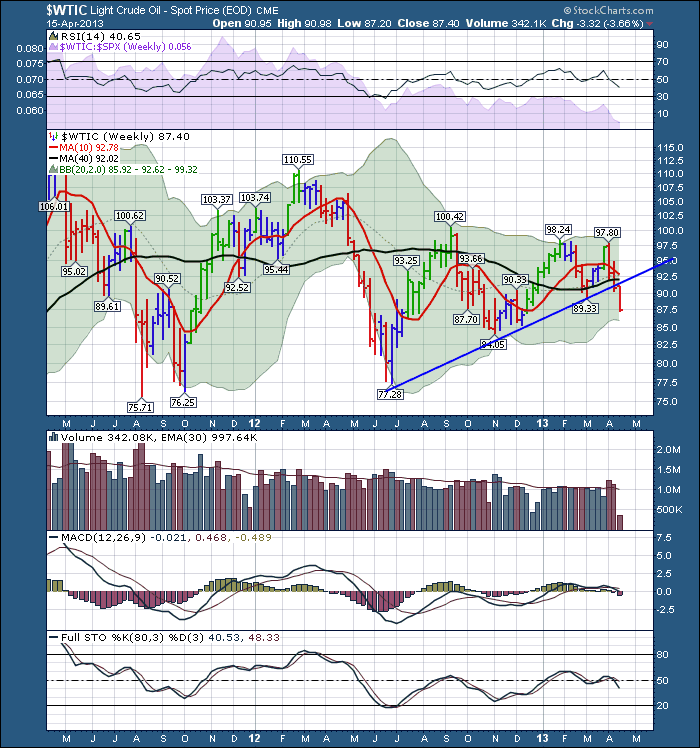
Oil
I want to show oil in another view. It is extremely important that this holds, I just don't believe it can after seeing the commodites and the indexes wash out like they did today.
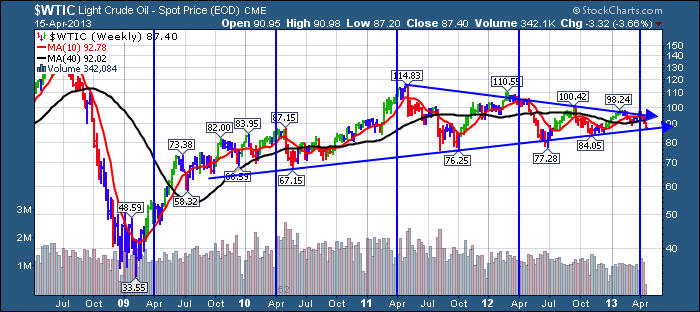
$WTIC now trades below both the 10 WMA and the 40 WMA. It has broken the rising trendline. But it came to rest on the single most significant trendline in the commodities book for me.
If this trendline fails to hold, I would suggest the $TSX could lose another 750 points in short order from here as oil falls down to lower levels. These long trend lines are very important. $WTIC may pause at horizontal support around $85 and if that can't hold, I would expect a quick visit to $77. Then the hand wringing will be in earnest as it was for Gold these last 3 trading sessions. A major violation of support at $76 would really knock the oil stocks into serious long term chart break downs. We won't worry about that yet, we'll keep watching where the price finds support. The blue vertical lines are placed at April as oil usually takes a breather from there into July. You'll notice the other trendline break in 2012 was near the end of the weak seasonality, not the start like now. So that worries me a bounce.
Lastly, my olive branch.
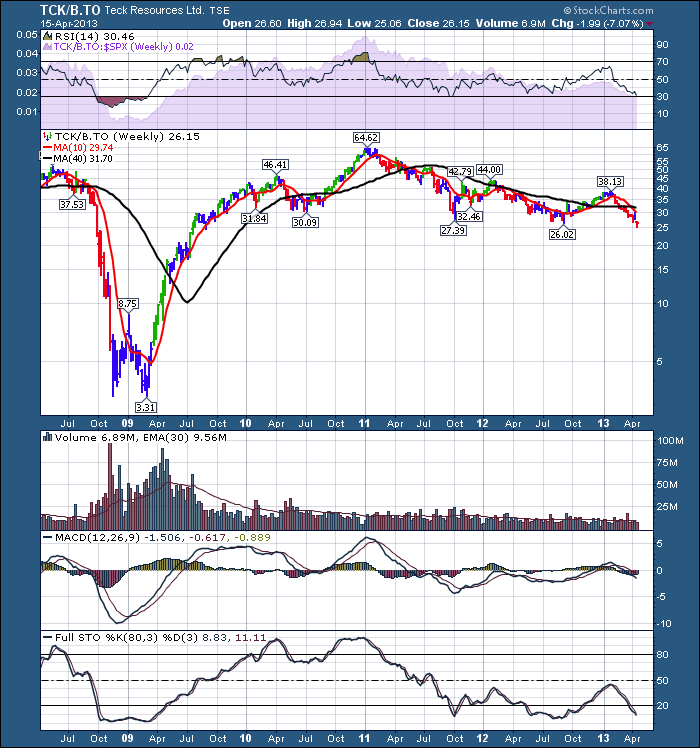
Check out this weekly chart of Teck Resources.
You can see the low into the top right of the chart title was $25.02. That marked a major 4 year trendline break. But there was a strong bounce into the close that pushed it back above the previous low of $26.02. That's the good news. The bad news is it has to stay up here all week so we don't make a lower close! It has to get up into the $27's to not really show weakness relative to the previous closes.
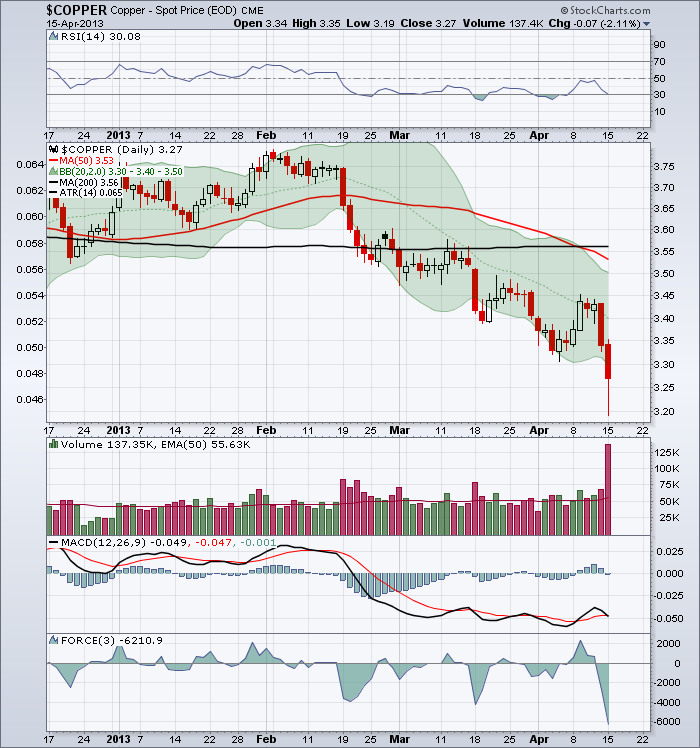
Lastly, I'll close with $Copper. It was my Olive branch today. Why? Look at the candle for the day.
So why is this good? Well, After breaking below the previous support of $3.24 (not shown), it went down and then closed well off the lows at least in the middle of the candle. Somebody came in and started buying. Look at the volume on this. Double what you see in the last four months while copper was weak. It has all the makings of a great capitulation day. Let's watch and see if it can rally from here. It is swimming against massive global tides. The indexes in many countries are in trouble technically on the charts as I have been blogging about for weeks. The other commodities are losing (have lost) support. Can this be a place to buy the miners, if only for a bounce? It might be worth watching. The MACD currently is at a slightly higher low..OK. Enough hoping. I'll be watching if the group can get support generally or does this pull the equity markets down in a spring lull.
Mr. Bond, would you like an olive?
Good Trading,
Greg Schnell, CMT
PS. Hopefully you have noticed all the cities the new training courses are being held at. The students who have come, love them. We are offering an advanced level that may interest some of you.
Here is the link. SCU

