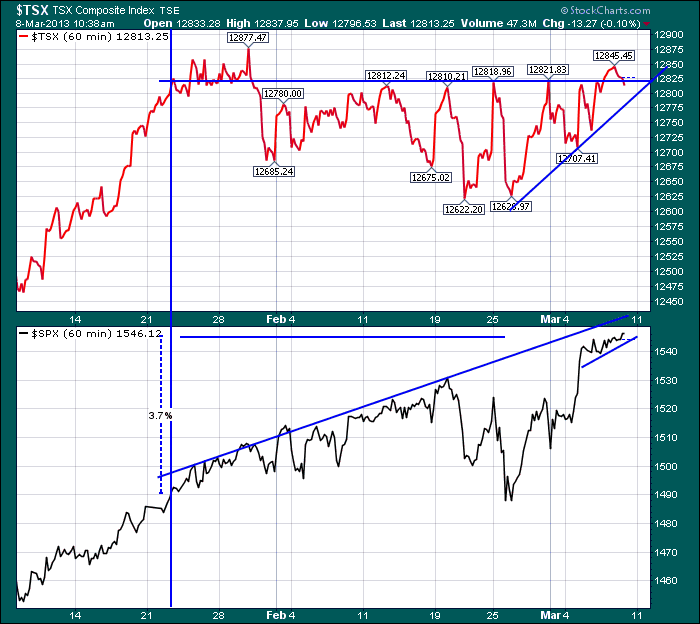
One of these things is not like the other. Looks like the Canadian market has been sitting in Tim Horton's for a coffee break, but the US market has been drinking Red Bull for the morning shot.
The charts below all have different number of dates. All the charts are 60 minute charts, but the number of days change.
While the $SPX has rallied nicely, the $TSX has been stuck in a sideways pattern.
The $TSX is flat after 7 weeks while the $SPX has piled on 3.7%.
I think it is important that commodities get going here. The chart above shows the $TSX first reaching the 12820 level at the vertical blue line on January 22. Today it tests this level again.
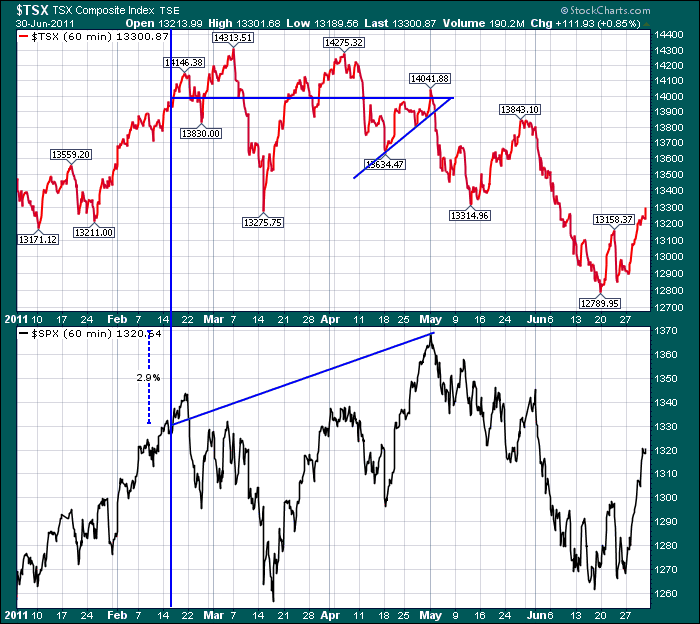
Lets just review one of the major divergences in the $TSX and the $SPX in recent years. This is 2011. Basically, the $TSX was trying to rally to new highs, but could not. This divergence ended up being an important thing to note. The $SPX rallied on 2.9% higher as shown to the left of the vertical line. The problem was the $TSX or the "commodity currency" could not follow along.
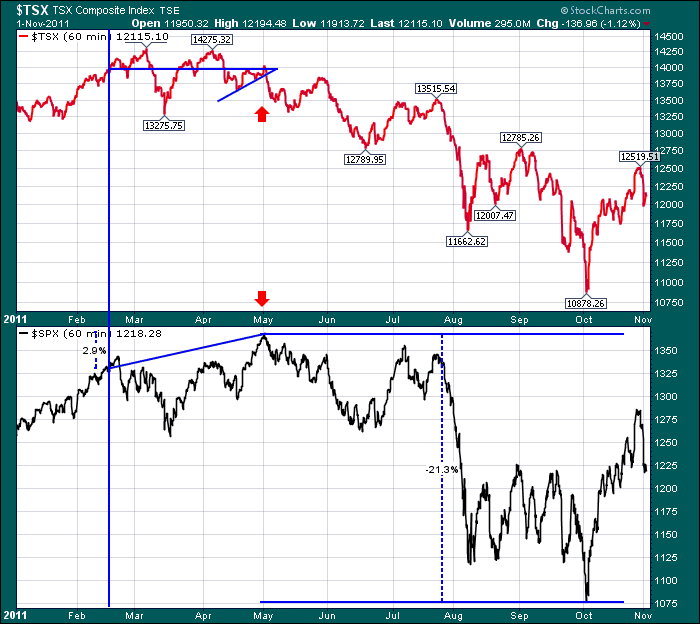
Below is how it worked out when commodities could not follow the US market higher.
We are watching for the commodities and the $TSX to turn higher. These charts illustrate why that is important. A commodities non confirmation is important. If the world does not need commodities, somethings amiss. So, I'm intently watching for commodities to get some love.
In case you missed it. New SCU courses are available. Seattle, Toronto and NYC all have the new 2 different levels program with SCU 101 on day 1 and SCU 102 on the following day.
Have a great weekend.
Good Trading,
Greg Schnell, CMT


