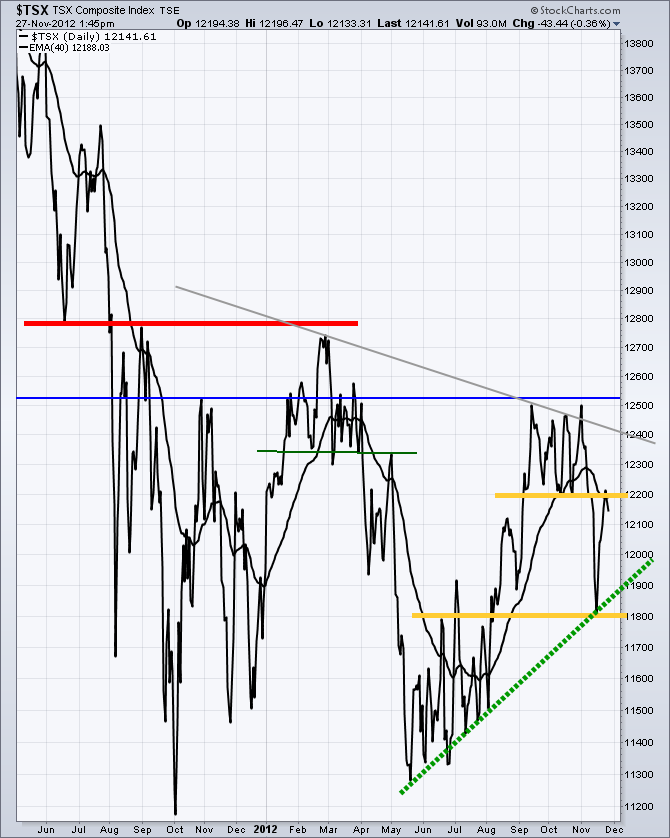
A local family was out for a walk in the mountains yesterday. They accidently found themselves near a bear. They were surprised and so was the bear. They startled the bear and the bear attacked them. This chart demonstrates why our market making ancestors named a 'down market' a 'bear'. It shows up almost randomly, attacks suddenly, is very painful and survival is not assured.
Remember this chart in the context of the US market continuing to go to new highs.
You can see that in the Spring of 2011, the bear market unloaded. The low in June 2011 was substantial resistance going forward. I have marked that with a red line.
As the market continued to rally in the US, the Canadian market found sellers coming in sooner on the highs and created resistance at the blue line extending through the chart.This would be the fall of 2011.
In early 2012 the market found support at the green line. When that support let go, it was significant. Where did the market find support? The fall led to a bottom in May 2012. Almost the identical level it found support in October 2011. You may remember the June July rally as being very choppy. I know it wore me out. Just when I though it was going to break down, it broke out topside. The lower yellow horizontal line could have been placed slightly higher or slightly lower depending on the charting artist. Say 11900 or 11650.
After breaking out, the market roared higher and topped out at significant horizontal resistance. The blue line that was resistance for the last year. It found a 300 point trading range with support at the upper yellow thick line.
That brings us to now.
So now the market has this question. Back into the upper range, or back down to test the 11800 low on the spike down? It is important to note that the spike down was also supported on the major trendline shown as a green dashed line off the May 2012 low. Beginning trendline artists may wonder why I did not draw my line off the Late June low. It is because there are 5 touches the way I have drawn the line and 2 points that were just shy or extended from that line. If I drew it off the June low, there would only be a May and a June touch. Each time a line is touched and a reversal is made, the strength of that line becomes more important. 5 (7) touches is huge. That is strong. At a minimum you need two points and a reliable trendline is better with 3 or more.
So here we sit. A series of rising lows, up against a former support line that has turned into resistance. A series of lower highs marked in light grey. Progress trading the market going higher will be measured by:
1) Breaking through and holding above the higher yellow line at 2200.
2) Significant resistance will be shown at 12500 -12550. A break above that level and a weekly close there will be immensely more bullish. Breaking above our 1 year resistance line is very bullish.
3) We continue to make lower highs. That's still a fact keeping the bears alive.
If you have followed my blog for a while, you'll know that I find the 20 month MA to be a decisive line for bull markets. Today, that line is at 12409. Interesting how close it is to the wider market technicals and the downtrend line.
So for simple long term investing like mutual funds like to do, this would be an important development. Every investor has a different style. This fact that some use monthly trendlines and another uses a 5 minute, a daily, or a weekly all blend to make a market.
We have drawn the lines in the sand. Depending on your time line, you'll move into or out of the market. The technicals point to an important time. Hopefully its a Merry Holiday season! But hope shouldn't be a trading strategy. Click on the chart and you should be able to see it in the bigger picture!
Remember, the Calgary Trading seminar is coming soon in February 2012. Its only 60 days away. Please enrol soon! If you are looking at Dallas you have even less time.
Good Trading,
Greg Schnell, CMT

