LULU can never be a lemon?
With 2 young adult daughters and a wife, I see a lot of LULU apparel. In the recyclable bag cupboard, I think it is dominated by the LULU shopping bag. I even joked about LULU at the last monthly CSTA meeting in Calgary. Not a laugh from the crowd. This is a serious cult much like the Apple fan base.
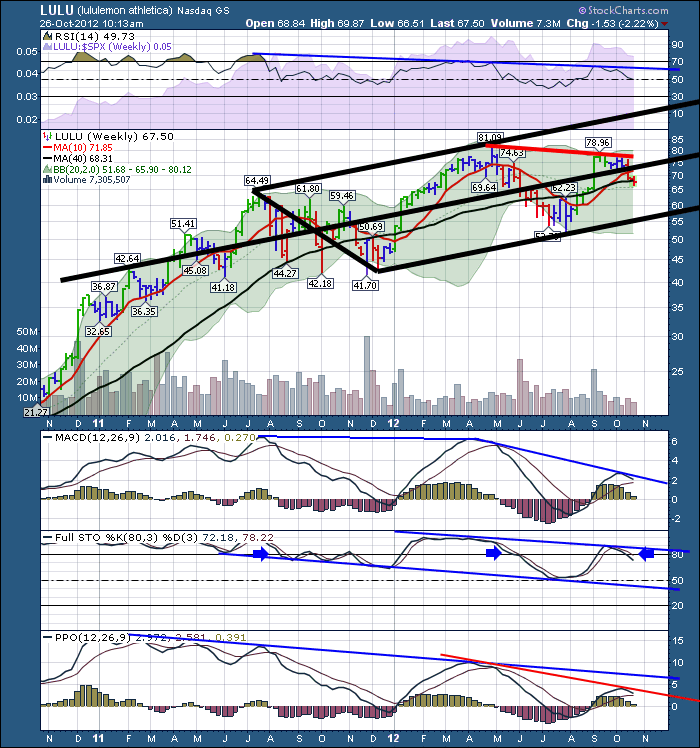
I tried to short LULU last year and the trade reversed and I got stopped out. These trendy apparel companies can be volatile. Here's the current chart of LULU.
LULU has expanded into mens clothing with some success. I am still LULU free. But never say never. My nephew says its the most comfortable clothing he owns.
Regardless of the customer interest and demographics, lets look at the chart as closely as the clothing fits to see how investors feel!
Starting at the RSI, the peaks have dimished over the years. Ok, just the last 2 years. More LULU jokes no one laughs at. The real problem is, this RSI trend over three peaks is usually consistent with a Head and Shoulders topping pattern. Now compare to the price. The RSI is confirming the price pattern. The SPURS purple area has been very strong. The recent SPURS (LULU:$SPX) peak was lower than the spring of 2012. You can also see it is underperforming the $SPX as the recent Relative Strength line (LULU:$SPX) is sliding.
On the Price bar, I overlaid the Andrews Pitchfork tool. This tool outlines a trend based on the stock price action. As you can see, the price is moving into the lower half of the trade channel. With respect to the price itself, here we sit at the 40 week MA with only 60 days to go till Christmas. This weak price action does not bode well for the stock. Similarly, the euphoria for LULU has dissipated along with the slowdown in euphoria towards the giant growth stocks. With 80% of the stocks following the macro trend, the big picture of the market can be as important as the fundamentals of the company. Notice that the LULU price in July of 2011 is roughly the same as our current price today.
The double top in LULU between the September and April high is very important data. LULU spent 6 weeks trying to break through the trendline from the April to early September highs. There doesn't appear to be any data for me currently within the Bollinger bands. Regarding the MA's, I have trouble with a growth stock trading below the average of the last 40 weeks (3/4 of a year) going into its most important season.
Before we look at the other oscillators, let us step back and look at the whole package. What is the general trend of all the overlays, indicators, oscillators over the last 2 years? What is the general trend of the price action for the last 2 years? OK. So for home work, how about going to check out how high flying apparel /retail stocks behaved like GPS from 1998 to 2001, EBAY 1999-2001, EBAY 2003-2005, EBAY 2011, CROX , HOTT, ZUMZ, AEO 2010-2011, WMT 1998-1999. You can go look at AMZN too. More on that in tomorrows blog. These help me find patterns or overlays that might be clues on when to exit.
Back to the MACD. The extremely lower high on the MACD when price was marking a double top is a full level 5 alarm for me. The down trend in the full sto's and the PPO ( I got email when I reviewed AAPL about not using PPO for long charts so here it is), is clear. The only bright light I see on LULU is that volume has dropped while the price has moved lower. I am stalking this for a move higher from here. But only for a short entry I think. Who knows, I may be all wrong and stopped out of my short position, but this chart looks like Cinderella's Chariot. In my mind, it's on the road to becoming a pumpkin. Oops, laid a Hallowe'en LULU joke in there.Maybe even a Lemon.
One last note. From HTMMIS, (Google if you don't know) most companies make their all time highs as a growth stock within 8 years of becoming a public company (IPO). They obviously may go on to new highs as an average company growing the business at an average rate over time and the stock price migrates up and down with the economic trend. The rapid period of outperformance happens early in most companies. Certainly not true for AAPL, AMZN, GOOG. Even their surge was moderated for a period of time. For most new innovative retailers, the growth momentum ends within 5 to 10 years.
Have a LULU of a weekend. Send a friend a LULU gift card. PUMP up the volume and get that yoga going. Get rid of that LEMON body style and get back to BUFF at the beach. This stock needs acceleration. Otherwise that 45 P/E is going to look more like a 45 year old stock supporting 45 extra pounds. Eventually it loses its luster.
Lastly, if you are interested in the new rollout of the Stockcharts University, there is lots of information in Chips announcement. I will be teaching some of the 101 level courses for Stockcharts. You can find out more at SCU. I'll be teaching the Calgary event February 2nd, 2013. The moment we posted the courses, we had 10% sign up. These courses fill up quick, so put it on your calendar now. The Calgary date is barely 90 days out. Check out the 3 shaded areas on the page to find the link to your local event.
Good Trading,
Greg Schnell, CMT

