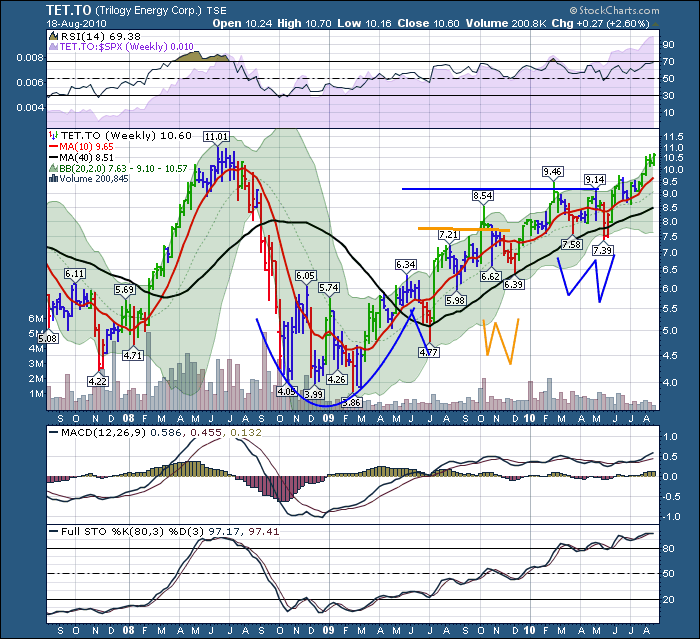
Lets move it out a year. Trilogy August 2010
The weekly RSI on Trilogy stayed in the top half of the RSI Band. Never touching 40. Beautiful.
Look at the price action on the chart. Twice, Trilogy put in a double bottom formation, shaking out weak holders of the stock. What I mean by that is if you used the previous low as your stop you got stopped out as the price moved below it on a weekly chart. Both times, the stock dropped below the 40 Week MA and reversed higher. Our philosophy on this price action is the institutions just scan for stocks in an uptrend that are currently near their 200 DMA and start buying! So why would a technician sell? We'll get into that but suffice it to say, if you give back the 20% from the recent highs to the lows and then get stopped out, you lose most of your gains or record a loss. This is where technicians get caught out in their early years. Mine included.
The longer term chartists like to buy the dips and have sell stops at the top of the range. Perhaps like Alexander Elder, you sell when it breaks the top of your channel. Then buy when it returns to the centre of the channel, for another run at the top. In Alexanders system, you specifically look to place your stop on a move down closer to your actual buy price, so you don't give up much! The red, green,blue candles are from the Elder Impulse system.
So, difficult to buy and hold in this news ridden market of Fed Speak, Greek debt, Foreign bla bla, and trouble in paradise. One of the nicer buy points in hindsight is trying to buy near the 40 week ma on stocks with a strong uptrend. Your institutional friends will probably be doing the same thing.
This is where Stockcharts scan engine comes in. Read some of the Best of Scan blog for ideas on how to do this. Scan for an uptrend, then scan for stocks at or below their 40 week MA. They'll look sick. They'll have red Elder candles. They'll make you think about shorting. We better do a blog about that later!
OK. We still have two years to go, and I don't plan to write an ebook here.
Good trading,
Greg Schnell, CMT
Don't forget...this UNBELIEVABLY good Banff conference is only 4 weeks away. We want to pack the house. Can you make it? More information by clicking on this banner link. It is all technically based, not fundamental based analysis. If you love Stockcharts and technicals, this will warm you up!


