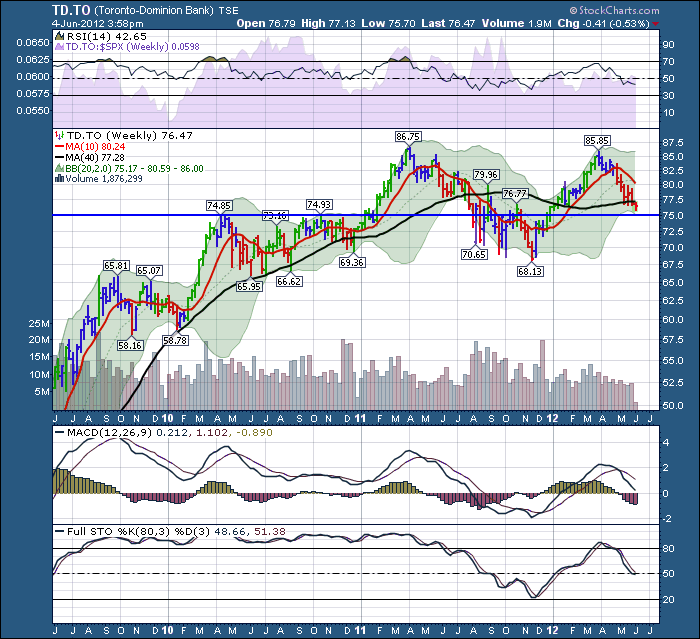
TD Bank is very interesting here. Look at it sitting on shelf support here.
TD bank just reported earnings. You can see it continues to make lower lows evey week even after a solid quarter. Fundamentals of a solid quarter? Whatever, lets talk technicals.
TD bank had a beautiful series of higher highs and higher lows until October / November 2011. It briefly broke below $70.65 and failed to hold above $69.36. TD pulled back just a little more than 20% before reversing to the upside with the LTRO rally. Well, a few things happened that technically damaged this chart. The September/ November area had trouble holding 40 on the RSI. While it didn't collapse, it does signal a weakening trend. On the rally to April, this stock didn't make it back to overbought. This too signals a weakening trend. The MACD continues to make lower highs and the last pullback went below zero. That is a good place to look for an exit on the next rise.
The stock made a lower high or at best a double top in late March early April. So now, things get interesting.
Can TD hold support here at the blue horizontal line? After being supported for the last 3 weeks with the 40 week MA, this week it failed to hold. The TD Bank needs to stay firm here. If not, I would suggest we'll go back down and test the $67.50 - $70.00 level. On a longer term basis, this would set up a double top scenario and the measurement would take you back to $53 on the chart. We do not want to see TD get that weak, so lets look for support here! More importantly, be prepared to make some decisions if this fails to recover here. Living below the 40 WEEK MA is not a good thing! Up until last summer, the 40 week was a great support area.
Good Trading,
Greg Schnell, CMT

