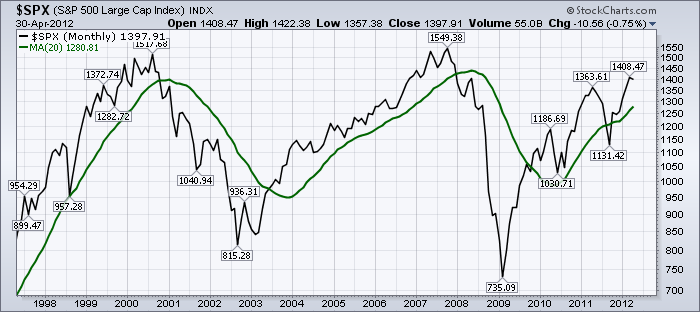
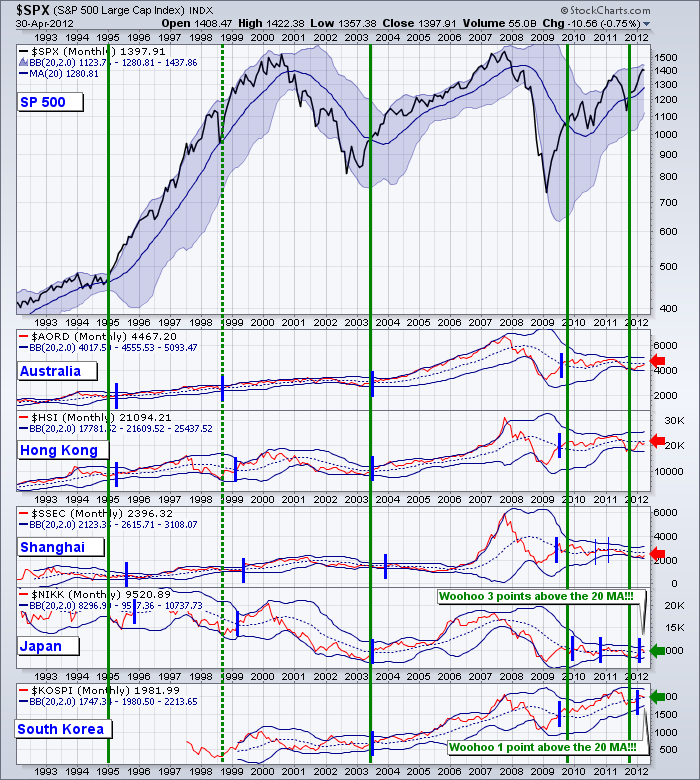
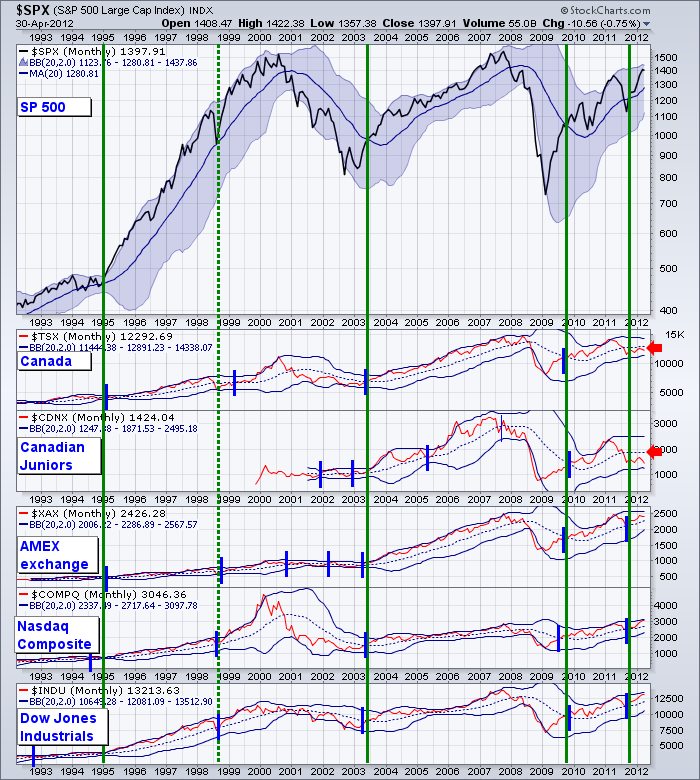
If we just use an $SPX chart with a 20 month MA, some simple data pops!
Notice the clarity of this chart. How it is always riding clearly above or below the 20 MA.
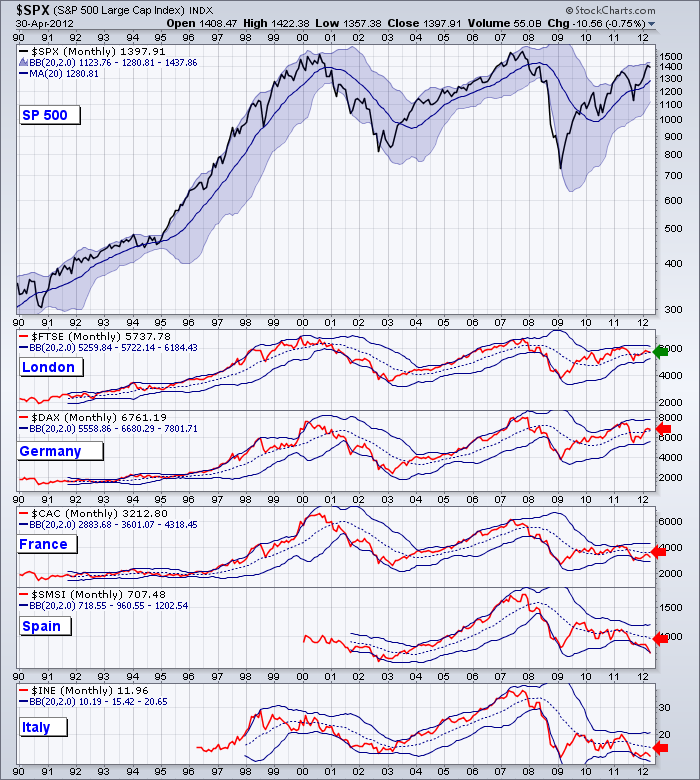
Let's compare to the other countries:
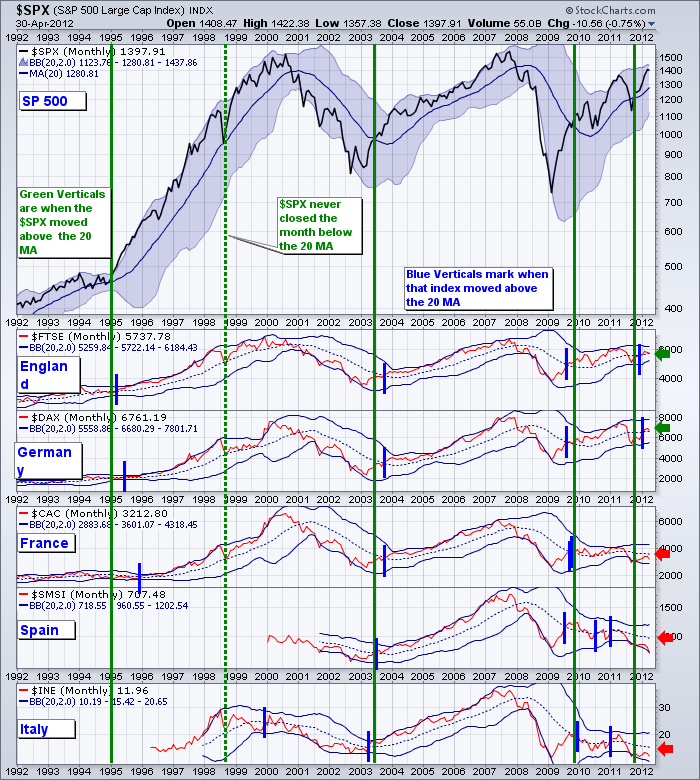
Here are the times when the US crossed to the upside. Look at the green lines. The blue lines on the Europe indexes represent the crosses of the other markets.
What I notice is how quickly they all followed in 2003 and 2009. Now look at the right side. Only two are currently above this rally after 7 months... yeah but Europe has problems. Lets check the BRIC countries.
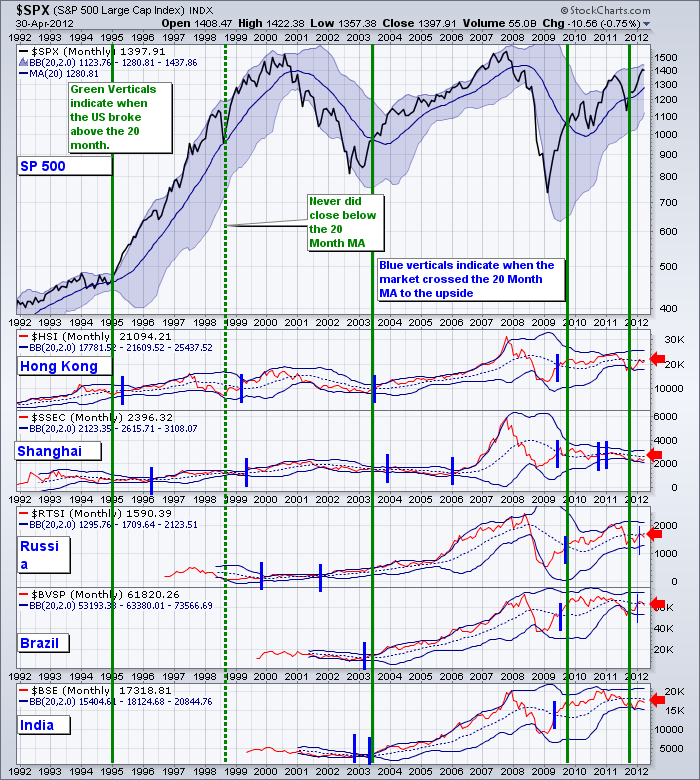
OK, that isn't working out well, most found the 20 MA resistance and are not anywhere near as bullish as the US. Some are trying to get above it, but a monthly close below is troublesome. How about Australasia?
Well, 2 are above but it couldn't be much closer. One is 1 point and the other is 3 points above the MA. Check the legend on the left corner. How about Canada? We sell 80% of our stuff to the US.
OK. With the exception of the few countries that are on their MA, nobody got an invite to the 2012 rally. Canada with all those exports is not noticing the growth.Weird at best. Every one of the BRIC countries are below. Of course the weak European countries are below. England and Germany are above. Only last Tuesday both England and Germany were below as well. All that to say it is moving and a fluid situation, but it has been the longest attempted rally to get the whole world going. Previously, they all jumped up within months. This is a begrudgng rally everywhere else. Unfortunately, most are not in agreement. Rather than be negative, at least we have a strong line in the sand to get bullish. Let's see if April delivers or if the US markets pull back and perhaps in June or October we'll get that thrust with the whole world order participating. It is the global growth that enables solid bull markets. We need that to start. When it does, bury the negative sentiment and get on the bull train. For now, its caution.
These charts are clickable.. link to connect, adjust the settings and blow them up to an easier size.
We have another tool. I'll cover that next blog.
I went to visit Stockcharts in Seattle and to speak to the Seattle MTA chapter last week. It was a great couple of days. A beautiful city with some great hosts. Couple of things really jumped out. Stockcharts University is not just about stockcharts. If you are having trouble turning consistent profits in your equity curve, try to enrol. Half the day is stockcharts basics, but the second half is about setting a trading plan, making it simple with stockcharts.com, what is in a journal, and where to focus your time. Sitting on losses? How to break that habit and follow the winners every week is what you'll learn. There is still space in the Seattle SCU on June 16th. The Chartcon conference in August promises to be outstanding. If you are on the fence, break out. You'll learn so much from the meeting and from fellow users.
Lastly, The CSTA, The Canadian Technican (Greg) and many local Calgary Volunteers are organizing an unbelievable commodities conference in Banff For September 9, 10, 11 2012. Follow the links below to the CSTA website and book today. The best room views sell out first but this is unbelievable value for world class conference speakers. Speaker list should be finalized soon.
Click on the link below.
The Banff Commodities conference!
You can follow me on twitter at schnellinvestor or on stockcharts Facebook.
Good Trading,
Greg Schnell, CMT

