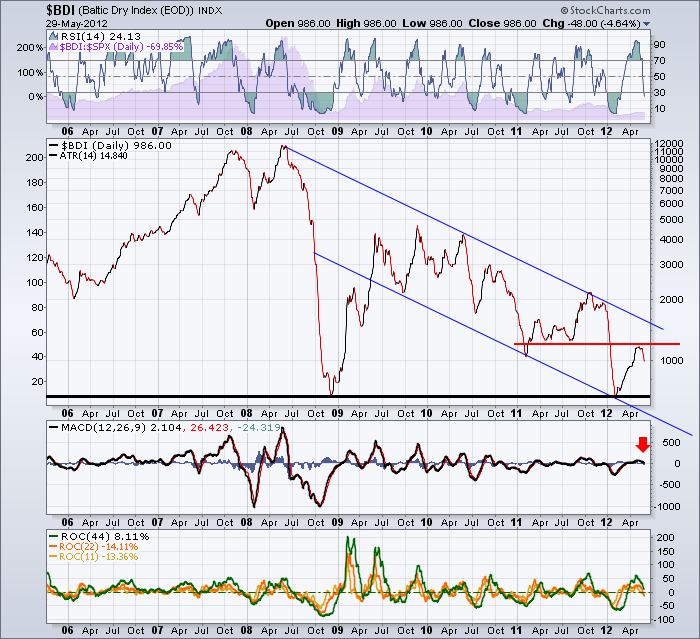
This chart represents the shipping of dry goods. 6 year chart.
Many people disregard this indicator as the ships ordered in 2007 bull market have been delivered over the past few years creating too large a fleet for demand. That said, the $BDI rallied off the October low. To see it roll over at the former support resistance line (red line) is BAD! Flat out Bad! This commodity space indicator is not healthy and the recent bounce was off the 2009 lows. Iceberg dead ahead? Keep watching $copper. Copper is making lower lows most weeks.
If you want to gain some real knowledge on trading commodities, investigate the outstanding conference the CSTA is holding in Banff, Canada. www.csta.org
Good Trading,
Greg Schnell, CMT

