Well, this Gold trade has worked most of the optimists into the prayer box. I believe it is still in a correction and this is my logic. You'll have to let me know if you agree or disagree.
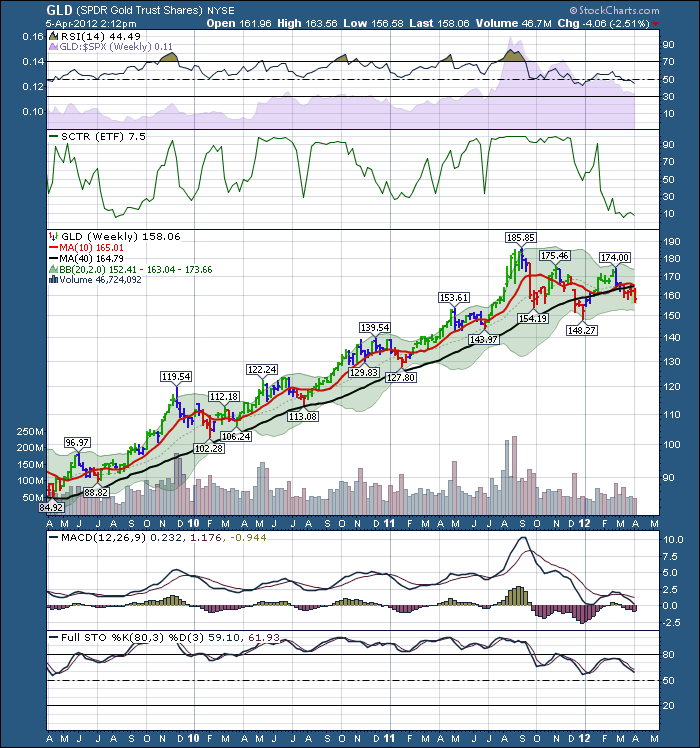
Here is the GLD chart.
Let's look at the SPURS behind the RSI. GLD continues to underperform the $SPX. As long as it continues to underperform, it is going to be difficult for hedge funds and money managers to move in. They like to buy outperformance, not guess when underperformance will turn.
The SCTR is clearly pointing to a weak ETF. If it started to move up above the 20 level, you could be looking at a mood change. But currently, it is in the bottom 10% of ETF performance.
The actual price continues to trade below the 40 WEEK MA. That is not good. It also has a confirmed downtrend with lower highs and lower lows. If the channel continues down, we would expect support around 142 or 143 for the next rally attempt.
The MACD rolling over again on the weekly is very bearish. The MACD breaking to new lows is not good even though the price hasn't.
The Full Sto's are breaking to new lows even though the price has not. That's negative.
So my target for GLD would be 143, and upside resistance to be at the junction of the 10 week and the 40 week. Looks like 165. Next week we may even see a 10 week below the 40 week. That confirms a downtrend. However, the 40 week is still sloping up, so that is some positive influence.
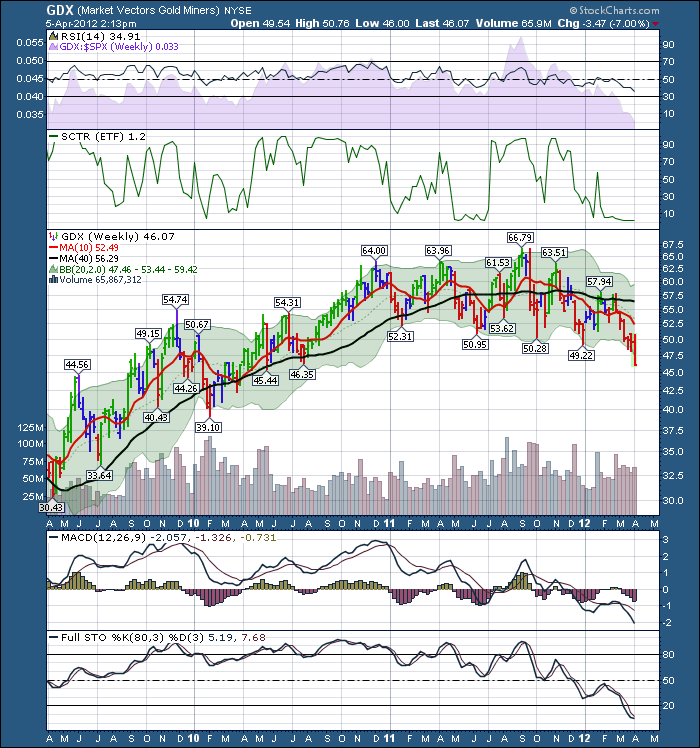
Lets compare it to the GDX chart. This is an ETF of the gold mining stocks.
Let's take a quick glance at the price and just compare it to the GLD chart. I see a confirmed downtrend. 5 lower lows. Let's analyze where the ETF actually changed moods from up to down.
Starting at the RSI. After touching 40 on the RSI in July 2011, the next rally was its last. Went up to 60, and pulled back below 50 again. Pretty much marked the final hope of the price action. Since that 60, then a pullback below 50, this has fallen with lower highs on every RSI move up.
The RSI is now sitting below 40 and looks extremely weak. When we look for a market to turn higher, we usually see a higher low on the RSI even as the price is bottoming. We would call that positive divergence. We are not seeing that yet as the RSI is making fresh lows.
The SPURS is clearly trending down, marking underperformance.
The SCTR is making lower highs and lower lows. Again, it is in the bottom 10% of the ETF's. Ok that is being nice. It is in the bottom 2% of the ETF's.
Let's look at the price action. 5 lower lows. Notice the price action in February 2011. We were making higher highs and then starting to make lower lows. The Next move up in April was a higher high, only to make a lower low. Notice how the RSI started to behave differently. It made a low that had not been seen during the uptrend of the previous 2 years. It also stayed below the 50 line for longer than it had previously. Eventually, the price could not make higher highs and continued to make lower lows. Nothing magical here. The RSI telling us when things were changing, but the range from 50 to 66 to 50 to 63 were huge. It is easy to see the topping in hindsight. Hard when the swings are 30% from high to low.
Lets move onto the MACD. Making lower lows, living below the zero line.
Full sto's. Making lower lows, living under the 20% level.
OK, So what's the trade. Well, to trade with the trend, I would need to sell short at the tops of each rally and close the trade as it approaches the bottom. We would expect the stocks to actually start perking up before the price of GLD starts to improve. When the stocks start to make higher lows, or even the MACD starts to make higher lows, then I might be able to buy the stronger stocks for holding for an uptrend. Currently the best trades look like selling rallies short or expecting sharp moves up for rally trades and selling near channel highs.
Overall, I think GOLD is trading like a commodity. When the whole commodity sector starts to improve, we might have better results in GOLD. Everyone thinks GOLD will trade in its own space, like an AAPL or PCLN, but it really looks similar to Canadian energy stocks and mineral stocks.
Those are my reasons for trading GOLD from the 'less bullish perspective'. Without using supply side, India Central Bank buying rumours, etc. Currently, the lust to own the shiny metal or the shiny metal stocks seems to be minimal from a group think. When we start to see some positive divergences, it should be a great trade. I expect most of the commodities will be as well.Rallies against the trend are usually swift as the short side traders cover to protect their gains. This buying pressure surges the stock up.
On a daily chart, Gold was recently flashing some optimism, but the weekly charts are telling us the trend is down. What's your trade analysis on GLD and GDX?
Good Trading,
Greg Schnell, CMT


