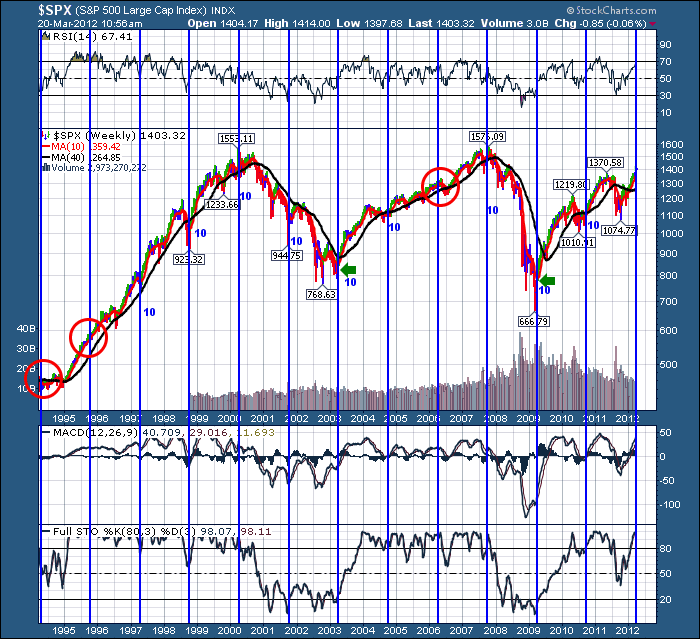
Lets describe how we started these lines. Well, the 2 best buy points on the chart are at the 2003 and 2009 lows. They look like places I would like to buy! I noted the locations with green arrows. When dragging the cycle lines out, I just try different spaces between the points. In this case, breaking the 2003 rally into 4 sections seemed to work best. However, you can see this cycle has been in place for a while. Out of 12 cycle locations,9 were consistent pullbacks before the cycle, and great buying opportunities at the cycle line. I decided I was going to mark the lines with relative quality for buying at a good breakout point. 10 being great, 7,5,3,1 being terrible. Well, I was shocked. Anything marked with a 10 was a great rally of at least 100 SPX points that started after a down turn. Too cool. That is 75% of the lines.
But there were 3 exceptions that I have marked in red.
The 1994 rally took 6 months before it got going. Not good at all.
The 1995 rally had no downturn, but just kept flying higher and higher. So still great! But no downturn to start from.
The 2006 rally had no downturn previous to it and ended up rolling over for a 100 point move down. OUCH!
The 2012 rally is about to start. However, it had no pullback prior to the cycle line. Will it behave like 1995 or 2006?
Good Trading,
Greg Schnell, CMT

About the author:
Greg Schnell, CMT, MFTA is Chief Technical Analyst at Osprey Strategic specializing in intermarket and commodities analysis. He is also the co-author of Stock Charts For Dummies (Wiley, 2018). Based in Calgary, Greg is a board member of the Canadian Society of Technical Analysts (CSTA) and the chairman of the CSTA Calgary chapter. He is an active member of both the CMT Association and the International Federation of Technical Analysts (IFTA).
Learn More
